氢气氧化详细动力学机理建模与宽工况验证研究(h2_paper)

摘要:
本文构建了适用于宽工况的氢气氧化详细动力学模型,涵盖298–2700 K、0.05–87 atm、当量比 0.2–6,包含 19 步基元反应,优化了H+O₂+M、H+OH+M等关键反应速率与热力学参数。通过激波管点火延迟、常压 / 高压层流火焰速度、稳焰组分分布及流动反应器浓度剖面系统验证,模型与实验高度吻合。灵敏度分析揭示H+O₂支链、HO₂/H₂O₂反应、三体复合是控制不同工况的核心路径。该机理优于 GRI-Mech、Konnov 等模型,为氢燃烧数值模拟提供高精度基础子机理。
A Comprehensive Modeling Study of Hydrogen Oxidation
MARCUS CONAIRE1 , HENRY J. CURRAN2 , JOHN M. SIMMIE1 , WILLIAM J.
PITZ3 , CHARLES K. WESTBROOK3
1 National University of Ireland, Galway, Ireland
2 Galway-Mayo Institute of Technology, Galway, Ireland
3 Lawrence Livermore National Laboratory, Livermore, CA 94551
Correspondence to: Henry Curran; e-mail:henry.curran@nuigalway.ie
ABSTRACT: A detailed kinetic mechanis m has been developed to simulate the combustion of H2/O2 mixtures, over a wide range of temperatures, pressures and equivalence ratios. Over the series of experiments numerically investigated, the temperature ranged from 298 to 2,700 K, the pressure from 0.05 to 87 atm, and the equivalence ratios from 0.2 to 6.
Ignition delay times, flame speeds and species composition data provide for a stringent test of the chemical kinetic mechanis m, all of which are simulated in the current study with varying success. A sensitivity an alysis was carried out to determine which reactions were dominating the H2/O2 system at particular conditions of pressure, temperature and fuel/oxygen/diluent ratios. Overall, good agreement was observed between the model and the wide range of experiments simulated.
INTRODUCTION
The prospect of a hydrogen-based economy has prompted increased interest in the use of hydrogen as a fuel given its high chemical energy per unit mass and cleanliness. It appears that most of the technological problems in using hydrogen in spark-ignited internal combustion engines, including NOx emissions [1], have now been solved; vehicular on-board storage is probably the one remaining difficulty [2, 3].
There is also continued interest in developing a better understanding of the oxidation of hydrocarbon fuels [4] over a wide range of operating conditions in order to increase ef- ficiency and to reduce the emission of pollutant species. All, or almost all petrochemical, fuels are hydrocarbons which burn to form carbon dioxide and water. Thus, the develop- ment of a detailed kinetic mechanis m for hydrocarbon oxidation necessarily begins with a hydrogen/oxygen sub-mechanis m, followed by the addition of CO chemistry.
In recent years, many kinetic studies of hydrogen oxidation have concentrated on a single set of experimental results obtained either in shock tubes, or in flow reactors or in flames; these have been simulated using a detailed kinetic mechanis m. This procedure has been criticised recently by s mith [5] who asserts that uncertainty limits on individual reaction rate constants produce a parameter space of possible mechanis ms still too im- precise for accurate prediction of combustion properties such as flame speed or ignition delay, thus requiring additional system data. s mith adds that low pressure and coun- terflow flames, mixtures in shock tubes, and flow or well-stirred reactors are examples of such experimental environments. It is the aim of this study to apply a hydrogen kinetic mechanis m to as broad a range of combustion environments as possible.
There have been a very large number of measurements made on the reaction between hydrogen and oxygen. These include flame speed measurements, burner stabilised flames in which species profiles are recorded, shock tube ignition delay times, and concentration profiles in flow reactor studies. This study aims to simulate these experiments using a detailed chemical kinetic mechanis m which takes its origin from Mueller et al. [6] in their study of hydrogen oxidation in a flow reactor. Mueller and co-workers validated their mechanis m using only their flow reactor data over the temperature range 850–1,040 K, at equivalence ratios of 0.3 ≤ φ ≤ 1.0, pressures of 0.3 to 15.7 atm and residence times of 0.004 to 1.5 s. We have exercised their mechanis m against shock-tube data, burner- stabilised flame experiments and flame speed data and have made modifications to some of the kinetic parameters in order to achieve better overall agreement between mechanis m simulations and this broader range of experimental results. Previously, Marinov et al. [7] had also developed a detailed H2/O2 kinetic mechanis m to simulate shock tube, flame speed and burner stabilised flame experiments with good agreement between model and experiment but a large body of datasets have become available since then. Therefore, this study presents a new detailed chemical kinetic mechanis m for hydrogen oxidation but with increased attention paid to experiments conducted at high pressures since internal combustion engines operate at elevated pressures.
Davis et al. [8] have recently presented a re-examination of a H2/CO combustion mechanis m in which they simulated some of the experimental data included in this study. Their work was motivated by new kinetic parameters for the important reaction H + O2 + M = HO2 + M and by new thermodynamic data for OH, and, had the objective of optimising their H2/CO model against experiment.
IGNITION DELAYS IN SHOCK WAVES
Schott et al. [9] measured ignition delay times of two H2/O2/Ar fuel mixtures behind incident shock waves over a wide range of reactant densities in the temperature range 1,085–2,700 K and at 1 atm. Skinner and Ringrose [10] measured the ignition delays of an H2/O2/Ar mixture in the temperature range 965–1,076 K and at a reflected shock pressure of 5 atm. Asaba et al. [11] performed experiments in the temperature range 1,500–2,700 K, at reflected shock pressures of 178–288 torr, at an equivalence ratio, φ, of 0.5 and with 98% argon dilution. Fujimoto et al. [12] measured ignition delay times of stoichiometric H2/O2/Ar fuel mixtures in the reflected shock pressure range 1.3–5 atm and in the temperature range 700–1,300 K. Hasegawa et al. [13] measured ignition delays in the temperature range 920–1,650 K, at a reflected shock pressure of 5.5 atm, with φ = 0.25 at 94% argon dilution. Bhaskaran et al. [14] reported ignition delay times for a 29.59% H2 , 14.79% O2, 55.62% N2 mixture in the temperature range 1,030–1,330 K and at a constant reflected shock pressure of 2.5 atm.
More recently, Slack [15] studied stoichiometric hydrogen-air mixtures in a shock tube and measured induction times near the second explosion limit. The experiments were performed at a reflected shock pressure of 2 atm in the temperature range 980–1,176 K. Cheng et al. [16] reported ignition delay times for a 6.67% H2, 3.33% O2, 90% Ar mixture in the temperature range 1,012–1,427 K and at a reflected shock pressure, P5 ≈ 1.9 atm. Koike [17] measured ignition delay times for two hydrogen/oxygen/argon fuel mixtures of incident shock pressure 20 torr in the temperature range 1,000–1,040 K.
In a methane shock-tube study, Hidaka et al. [18] carried out some measurements of a H2/O2/Ar mixture at 1,250–1,650 K and at reflected shock pressures of 1.6–2.8 bar. Pe- tersen et al. [19] measured high pressure (33–87 atm) H2/O2/Ar reflected shock ignition delays at 1,189–1,876 K and at an equivalence ratio of 1.0 in every case for six mixtures. Petersen et al. [20] measured reflected ignition delay times in three highly dilute H2/O2/Ar mixtures at temperatures of 1,010–1,750 K, equivalence ratio range 1.0 ≤ φ ≤ 1.47 and around atmospheric pressure. Finally, Wang et al. [21] carried out reflected shock mea- surements in various H2/air/steam mixtures at 954–1,332 K and pressures of 3.36–16.63 atm. Hydrogen concentration was 15% of air throughout.
FLAME MEASUREMENTS
Atmospheric Flame Speed Measurements
Very many hydrogen/air flame speed studies have been performed at atmospheric pressure, over various ranges of equivalence ratio. Koroll et al. [22] reported data in the equivalence ratio range 0.15 ≤ φ ≤ 5.5, Iijima et al. [23] in the range 0.5 ≤ φ ≤ 3.9 and Takahashi et al. [24] in the range 1 ≤ φ ≤ 4. However, these data did not account for the effects of flame stretch.
The earliest stretch-corrected atmospheric hydrogen/air flame speed experiments were performed by Wu et al. [25] in the range 0.6 ≤ φ ≤ 6. Since then, stretch corrected flame speeds, all of which were performed at 1 atm, have been reported at various equivalence ratio ranges: Egolfopoulos et al. [26] (0.25 ≤ φ ≤ 1.5), Law et al. [27] (0.4 ≤ φ ≤ 1.5), Vagelopoulos et al. [28] (0.3 ≤ φ ≤ 0.55), Dowdy et al. [29] (0.3 ≤ φ ≤ 5), Aung et al. [30] (0.3 ≤ φ ≤ 5) and Tse et al. [31] (0.4 ≤ φ ≤ 4), Fig. 1.
The measurements of Takahashi et al. [24] are considerably faster than the rest of the data and 10 % faster than the intermediate values of Tse et al. and Dowdy et al. at an equivalence ratio of 1.75. The slowest flame speeds are those of Aung et al. [30] which have a maximum flame speed of 2.6 m s—1 at φ = 1.65. The authors point to possible
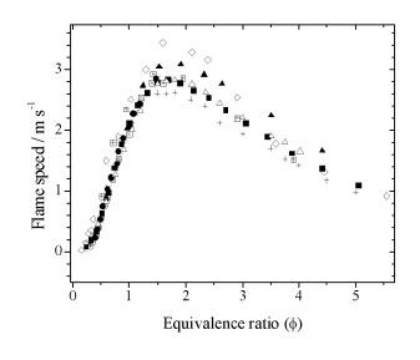
Figure 1: Atmospheric H2/O2/air flame speeds versus equivalence ratio, Ti = 298 K. ◇ Koroll et al. [22], 田 Iijima et al. [23], ▲ Takahashi et al. [24]; stretch–corrected: ☒ Wu et al. [25] × Egolfopoulos et al. [26], • Law et al. [27], 于 Vagelopoulos et al. [28], ■ Dowdy et al. [29], + Aung et al. [30] and △ Tse et al. [31].
greater stretch effects than accounted for to explain the relative slowness of their data. The Koroll et al. values [22], on the other hand are much faster than any other between 1.0 ≤ φ ≤ 2.5. The recent flame speed measurements of Dowdy et al. [29] and Tse et al. [31] probably are the most representative of the entire dataset; they have a maximum flame speed of 2.85 m s—1 at φ = 1.75.
Lamoureux et al. [32] very recently measured the speeds of freely propagating flames in a spherical bomb for five H2/air mixtures using a diluent consisting of CO2 + He to mimic the effect of water vapour on flame speed. The mixtures were composed as follows: 父(40%He + 60%CO2) + (1 一 父)(H2 + air), where 父 ranged from 0.0 to 0.4, and with synthetic air of composition O2 : N2 = 20 : 80.
High-Pressure Flame Speeds
In addition to their atmospheric flame speed measurements, Tse et al. [31] also measured mass burning velocities for H2/O2/He mixtures in the equivalence ratio range 0.5 ≤ φ ≤ 3.5 and between 1 and 20 atm at an initial temperature of 298 K. It was reported that flames became increasingly unstable at elevated pressures. For this reason, true stretch-free flame speeds become more difficult to measure. Experimentally, in the case of the 10–20 atm data, the oxygen to fuel ratio was reduced to suppress diffusional-thermal instability and delay hydrodynamic instability. Using helium as the diluent also helped minimize instability up to 20 atm by reducing the Lewis number of the flame and retarding the formation of flame cells. Stretch-free flame speeds have only been available up to a few atmospheres. The oxygen to helium ratio at 1 to 5 atm was 1:7 (12% dilution) and at elevated pressures, this ratio was 1:11.5 (8% dilution).
Burner Stabilised Flame
In their investigation of a rich 18.83 % hydrogen, 4.6 % oxygen, 76.57 % nitrogen flame at atmospheric pressure, Dixon-Lewis et al. [33] measured the temperature profile and the concentration profiles of the stable species in the flame, above and below the burner. Flame structure measurements had been carried out by Kohse-Ho…inghaus [34] who measured H. and O.H radical concentrations versus distance in a H2/O2/Ar flame, at a pressure of 95 mbar, in the equivalence ratio range 0.6 ≤ φ ≤1.4 and in the temperature range 1,100– 1,350 K. Vandooren and Bian [35] investigated the structure of a rich H2/O2/Ar flame over a flat burner at a pressure of 35.5 torr and at an equivalence ratio of 1.91. They reported H2, O2, H2O, H., O. and O.H species mole fractions versus distance above the burner.
Flow Reactors
Mueller et al. [6] measured H2, O2 and H2O profiles over the temperature range 850 to 1,040 K, at equivalence ratios of 0.3 ≤ φ ≤1.0 in the pressure range from 0.3 to 15.7 atmospheres and over a range of residence times of 0.004 to 1.5 s. Previously, Yetter et al. [36] reported atmospheric H2 , O2 and H2O profiles at 910 K, and at an equivalence ratio of 0.3.
Experiments Simulated
A representative selection of recent experimental work has been chosen to validate the H2-O2 combustion mechanis m. The chosen experiments were:
1. the ignition delay times measured by Schott et al. [9], Skinner et al. [10], Fujimoto [12], Bhaskaran et al. [14], Slack [15], Cheng et al. [16], Petersen et al [19], Hidaka et al [18], Petersen et al. [20] and Wang et al. [21]. Simulations of the data of Asaba et al. [11], Hasegawa et al. [13], and Koike [17] were not attempted in this study because of a lack of sufficient information.
2. the flame speed measurements of Dowdy et al. [29]. These flame speeds not only span a wide range of equivalence ratio but are in agreement with the more recent values of Tse et al. [31]. Dowdy and co-workers also measured the temperature profiles, thus making their data more amenable to simulation.
3. the high-pressure flame speed measurements of Tse et al. [31]. This data is the only set where hydrogen flame speeds have been measured at pressures greater than 5 atm.
4. the very lean H2/air and H2/air/CO2/He flame speed measurements of Lamoureux et al. [32].
5. the burner stabilised flame profiles of Vandooren et al. [35] in which reactant and intermediate species concentrations were measured as a function of height above the burner surface. Also included are the species profiles of Dixon-Lewis et al. [33].
6. the comprehensive flow reactor data of Mueller et al. [6] along with a single data set from Yetter et al. [36].
CHEMICAL KINETIC MODELING
The chemical kinetic mechanis m was developed and simulations performed using the HCT program [37]. Initially, ignition delay times measured by Slack [15], Fig. 8, and Hidaka et al. [18], Fig. 7, and the flow reactor experiments of Mueller et al. [6], Fig. 25, were simulated with very good agreement observed between experiment and model. The mechanis m was then converted into Chemkin 3.6 [38] format and the simulations repeated in order to compare results from both codes, which were in very good agreement as expected. Thereafter, all other experiments including the flame speeds and the burner stabilised flame profiles were simulated using only the Chemkin applications.
Thermodynamic and Transport Properties
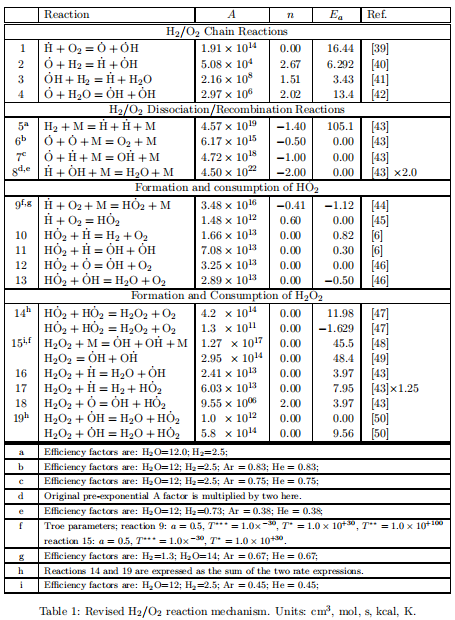
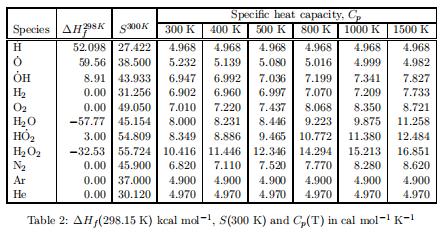
The H2/O2 reaction mechanis m consists of nineteen reversible elementary reactions, Table 1, together with the thermochemical data, Table 2. Reverse rate constants were computed by microscopic reversibility. The thermochemical data for each species considered in the mechanis m are from the Chemkin thermodynamic database [51] with the exception of two:
1. ∆Hf(HO.2 , 298K) of 3.0 kcal mol—1 , from Hills and Howard [52] which is in good agreement with the recent reappraisal by Ramond et al. [53] of 3.2±0.5 kcal mol—1 .
2. ∆Hf(O.H, 298K) of 8.91 kcal mol—1 which is based on recommendations by Ruscic et al. [54] and Herbon et al. [55].
The Chemkin database of transport parameters was used without modification. As in the study of Tse et al. [31], the kinetic parameters of helium were assumed equal to those of argon in order to simulate flame propagation where helium is the diluent. As Tse et al. noted, using the third body efficiency of argon for monatomic helium is a useful starting estimate; termolecular reactions such as H. + O2 + M = HO.2 + M become significant at el- evated pressures and so the uncertainties in these values can create considerable differences in the flame speeds.
Mechanis m Formulation
The kinetic mechanis m referred to in this study as ζthis study’ or the ζ revised mechanis m ’ has its origins in the CO/H2/O2 reaction mechanis m of Yetter et al. [56], which was updated later by Kim [57] and is, for the most part, taken from the more recent work of Mueller et al. [6].
We found it necessary to modify some of the kinetic parameters of Mueller et al. in order to achieve an overall improvement with all the experimental data simulated here. This altered version of the mechanis m, Table 1, the revised mechanis m, reproduces the selected experimental datasets more accurately than that published by Mueller and co- workers.
The entire data set has also been simulated using relevant portions from Leeds 1.5 [58], Konnov [59, 60] and GRI-Mech 3.0 [61] which are all primarily methane oxidation mechanis ms. The reason for using both Konnov mechanis ms is that the shock tube data presented in Figs. 4-6 was used to validate version 0.3 while the more recent version 0.5 was used to simulate the remaining data. A select set of experiments is reproduced here using GRI-Mech, Leeds and Konnov as an indication of their performance but they have not been comprehensively tested.
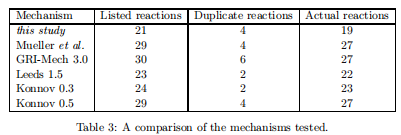
A comparison shows that these mechanis ms are quite different, Table 3; not only do the total number of reactions differ but so do the rate constant expressions.
详细内容请见附件
免责声明:
本页面/内容部分素材来源于互联网公 开 信 息,旨在传递更多信息,不代表本平台立场。
版权归原作者或机构所有,如涉及侵权,请通过平台联系我们,我们将在核实后第一时间处理。
本平台对转载内容的真实性、准确性不作任何保证,用户需自行判断并承担使用风险。