超临界水氧化甲醇动力学研究

超临界水氧化甲醇动力学研究(A Kinetic Study of Methanol Oxidation in Supercritical Water)
摘要:
本文在 253 bar、673–773 K 超临界水环境中研究甲醇氧化动力学,采用等温活塞流反应器与气相色谱检测。实验以 H₂O₂为氧源,甲醇初始浓度 0.88 mol%,O₂/MeOH 摩尔比 1.5–3.0,发现反应速率与氧气浓度无关。产物以 CO、CO₂为主,CO 产率在 723–748 K 出现峰值,CO₂产率随停留时间单调升高。反应遵循串联一阶路径 CH₃OH→CO→CO₂,低温由甲醇氧化控制,高温由 CO→CO₂控制。拟合得到总反应 Arrhenius 参数 A=10¹¹・⁸ s⁻¹、Eₐ=178 kJ/mol,为超临界水氧化处理有机废物提供动力学依据。
The oxidation rate of methanol in supercritical water at 253 bar and temperatures between 673 and 773 K is investigated using an isothermal, isobaric plug-flow tubular reactor and GC/FID and GC/TCD chromatographic methods. Experiments are conducted at a nominal methanol feed concentration of 0.88 mol % (1.53 wt %) using H2O2 as an initial oxidant. In some experiments, the O2/MeOH molar ratios are varied from 1.5 to 3.0 and show that the rate of methanol oxidation is independent of the oxygen initial feed concentration. Overall first-order rate constants calculated from the data lead to Arrhenius parameters of A = 1011.8 s-1 and Ea = 178 kJ/mol (42.5 kcal/mol). The identified reaction products are mainly CO and CO2. The temporal variation of the CO yield exhibits a maximum at temperatures of 723 and 748 K, whereas the CO2 yield increases monotonically over the experimental range of residence time (3-50 s). The experimental data are consistent with a set of consecutive first-order reactions CH3OH → CO → CO2. The global rate-controlling step in the complete oxidation of methanol is the conversion of CO to CO2. The first-order rate constants calculated for CO oxidation to CO2 lead toA = 1010.8 s-1 and Ea = 172 kJ/mol (41.0 kcal/mol). Kinetics of this system may be useful to study supercritical water oxidation (SCWO) of polychlorinated biphenyls (PCBs) dissolved in methanol.
1. Introduction
Supercritical fluid extraction/reaction processes are of both scientific and technological interest. Physical properties of supercritical fluids (SCFs) are intermediate between those of liquids and gases and can serve as a bridging system to better understand processes occur- ring in liquid and gas phases. An attractive technolog- ical application is the potential to replace hazardous organic solvents with environmentally “green” solvents such as supercritical CO2 and H2O.
The broad field of reactions in SCFs has been re- viewed by Savage et al.1 Interest in chemical oxidation processing in SCFs has recently placed emphasis on understanding the relationships between high-temper- ature, low-density combustion processes and intermedi- ate-temperature oxidation at near-liquidlike densities. The more recent work in this field has strengthened the an alogy between combustion chemistry and supercriti- cal water oxidation (SCWO) chemistry.2-5
One of the promising applications of SCFs as a reaction medium is in the waste treatment technology via SCWO. Water above its critical point (Tc = 647 K, Pc = 221 bar) is highly miscible with both organics and oxygen. SCWO technology has been shown to be effec- tive for destroying a large variety of industrial and high- risk wastes.6-9 The SCWO process is conducted at temperatures and pressures above the critical point of water and is considered applicable to aqueous streams containing 0-20% organics.10 As this technology has become commercially available, 11,12 interest in process development research has been shifting from feasibility demonstration to the evaluation of process scale-up costs. To accurately evaluate these costs, knowledge of operational reaction conditions regarding pressure, tem- perature, and residence time is needed. This evaluation
* Corresponding author. E-mail: lltavlar@ecs.syr.edu. Fax: 315-443-1243. Tel: 315-443-1883.
† On leave from Department of Physical Chemistry, Bucha- rest University, Bucharest 7034, Romania.
will be hindered without better predictive kinetic mod- els. However, agreement between models and experi- mental data is only qualitative in most cases. Although the efficacy of the SCWO process has been proven, reaction kinetic studies of the process are still at a level of simple systems such as MeOH. Because of the low solubilities of most solid organics in the aqueous liquid feed stream, a viable alternative is to employ a second solvent to deliver a solid organic reactant when execut- ing laboratory-scale kinetic studies. The required prop- erties of a potential solvent, e.g., for polychlorinated biphenyl (PCB) congeners, may include a simple chemi- cal structure which presumes a simple oxidation chem- istry and an ability to dissolve the wide variety of hazardous organics (209 PCB congeners) and to con- sume a minimum amount of oxygen for its own oxida- tion. One of the most studied organic compounds in SCWO appears tobe methanol.3,5,13 Moreover, methanol is largely employed as a cosolvent in supercritical fluid extraction processes.
Previous experimental studies of methanol SCWO were designed and performed for purposes of testing different detailed chemical kinetic models3,5,13 or testing the applicability of combustion mechanis ms at SCWO conditions.3 Consequently, the temperature range was chosen to be around 773 K or higher, and residence times were in a very narrow range of 0-3 s with only a few experiments up to 10 s (Table 1). Table 1 also displays the pressure values and the feed conditions of the reactor such as initial methanol concentrations and the values of O2/MeOH molar ratio for the above references.
Better predictive models for SCWO equipment design require more accurate experimental data. There are significant discrepancies between different sets of ex- perimental data, leading to significant differences in fundamental parameters of the process such as fre- quency factor (A), activation energy (Ea), and even the temporal conversion at different temperature levels. The data points of the same experiments are often too scattered. This lack of suitable data over a wider range of residence times and temperatures led us to initiate the present work. Our experiments are designed to fill these gaps in the literature data and to serve as a model for future SCWO studies of PCBs.


Figure 1. Schematic of the supercritical water oxidation flow reactor.
scattered. This lack of suitable data over a wider range of residence times and temperatures led us to initiate the present work. Our experiments are designed to fill these gaps in the literature data and to serve as a model for future SCWO studies of PCBs.
2. Experimental Section
2.1. Apparatus. All of the methanol oxidation experi- ments in supercritical water are conducted in a high- pressure, isothermal plug-flow tubular reactor capable of continuous operation at temperatures up to 873 K and pressures up to 689 bar.14 The plug-flow reactor, schematically presented in Figure 1, consists of three major subsystems: pumps and preheaters, reactor, and cooling and separation. In the pump and preheating subsystem, methanol and oxidant (H2O2/H2O solutions) are delivered in separate lines by high-pressure feed pumps: an ISCO 100-D single-stage syringe pump (HPP-1, 1 μL/min to 25 mL/min) and a Dynamax SD-1 (RAININ) two-piston, continuous-flow pump (HPP-2, 0.005-50 mL/min), respectively. The oxidizer preheated high-pressure tubing (1.6 mm i.d., 3.2 mm o.d., ~400 cm long) is Hastelloy C-276 while the methanol feed line is stainless steel tubing (~100 cm long, 0.25 mm i.d). The temperature is monitored at both the inlet (in the centerline offlow) and outlet (on the tubing wall) of the reactor. Further, to ensure conditions of near isothermal operations, three additional thermocouples (not shown in Figure 1) are inserted throughout the sand bath. Three sections of Hastelloy tubing of 100, 300, and 700 cm provide reaction volumes of 2, 6, and 14 mL, respectively, and permit the residence time tobe varied from approximately 3 to 50 s. The unthermostated section of the end of the reactor (~10 cm) is short relative to the total reactor length. The reactor and the preheating coils are immersed in a fluidized sand bath SBL-2 (Techne), which allows isothermal operation by three heaters and air flow. The cooling and separation subsystem consists of two water-cooled glass separators fabricated at Syracuse University. During the experi- ment, the effluent gas passes a flowmeter FM (Fisher Brand Electronic).
2.2. Procedure. The oxidizer is fed to the system in the form of a solution of H2O2/H2O pumped by the RAININ pump. It is subsequently thermally decom- posed in the preheating section to a high-pressure mixture of O2 in supercritical water. The preheated methanol and oxidant streams, at the desired experi- mental temperature, are mixed in a mixing block by combining the flows at a 45° angle of incidence. The combined flow exits the block on the oxidant line direction and then passes into the reactor subsystem. This particular structure of the mixing device is suitable when using two streams with significantly different flow rates. In a given experiment, the pressure in the reactor is fixed by controlling the total flow rate of the reactants/ reaction products at the entrance and the exit of the reactor. Leaving the reactor, the effluent stream passes through the micrometric valve (MMV, Autoclave Engi- neers Inc.), the stream pressure is dropped to ambient conditions, and the gaseous and liquid phases are separated in either one of two separators connected in parallel. During the unsteady-state portion of the reac- tion, the cooled products are collected in the first separator and removed later. The products of the steady- state reaction (5-10 min) are depressurized, cooled, and separated in the second separator and further an alyzed by chromatographic methods. The procedure is repeated 3-5 times for each of the conversion points.
2.3. Ana lytical Technique. Chromatographic data are obtained by two Hewlett-Packard 5890 series II gas chromatographs. The gaseous phase is captured into a 250-μL sample loop and an alyzed by on-line GC/TCD. The temperature program is 30 °C (2 min) to 45 °C (1 min) at 15 °C/min and then to 85 °C (3 min) at 15 °C/ min. Helium is used as the carrier gas. A calibrated mixture of O2, N2, H2, CH4, CO, and CO2 (balanced by He) is employed as standard gas (SCOTTY II, MIX-234). The liquid phase is diluted and an alyzed by off-line capillary GC/FID to measure the amount ofunreacted methanol. GC separation is achieved on a capillary DB-1 column (30 m × 0.32 mm i.d., 3 μm film thickness, J&W Scientific). Helium is used as the carrier gas with a flow rate of 2.5 mL/min (at 150 °C). The split ratio is 1:25, and the volume of injected samples is 1 μL. The GC oven is programmed from 90 °C (2 min) to 160 °C (2 min) at 10 °C/min. The injector is kept at 250 °C and the FID at 300 °C. Nitrogen is employed as a makeup gas at 30 mL/min. The GC is calibrated after every 10 samples by standard solutions of MeOH/H2O, and errors are found to be less than 4%. Even though this an alytical method provides a good separation of methanol and formaldehyde from standard solutions, the latter is not detected in the samples (detection limit of formaldehyde is ~1 ppm).
2.4. Reactants. For all experiments the oxidant is O2, supplied as a solution of hydrogen peroxide of different concentrations prepared from 30 wt % H2O2/ H2O solutions (purum p.a., Fluka). The purity of metha- nol (Optima, Fisher Scientific) is minimum 99.9%, and the feed is 0.88 mol % (1.53 wt %) in a balance of water (distilled and deionized). All reactants are used with no further purification.
2.5. Residence Time Calculation. Residence times are calculated by considering the flow rates of the methanol and oxidizer into the system. On the basis of the mass balance of the materials at the input and output of the plug-flow reactor, an equation for the residence time can be obtained in the simple form
τ = VR (pout/pin)/vin (1)
The residence time (τ) is in s, the volume of the reactor (VR) is in mL, the densities of the H2O2/H2O solutions are in g/mL, and the initial flow rate of the liquid reactants at ambient conditions (vin) is in mL/s. The density of water at reaction conditions is calculated using NBS Steam Tables.15
3. Results and Discussion
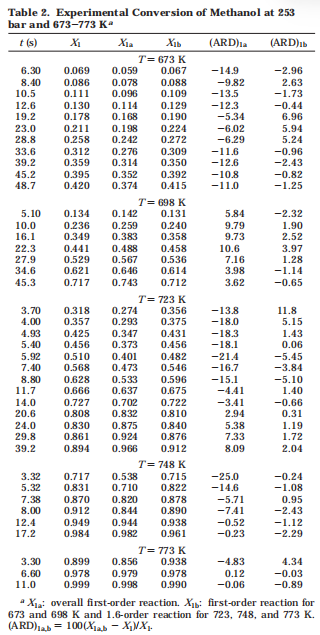
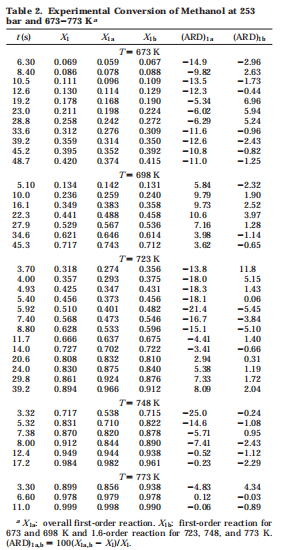
The experimental results of the oxidation of methanol in supercritical water at 253 bar and 673, 698, 723, 748, and 773 K for initial methanol feed concentrations of 0.88 mol % (1.53 wt %) are included in Table 2 and Figure 2. The second column of Table 2 displays the conversion of methanol, X1, expressed as the ratio of the reacted methanol to the initial concentration:
X1 = [MeOH]reacted/[MeOH]0 = ([MeOH]0 -
[MeOH]τ)/[MeOH]0 (2)
where [MeOH]τ is the measured effluent concentration after residence time τ. The conversions of methanol represent the average of at least three experimental data points with a maximum standard deviation of~5%. Conversions range from 6.9% (6.30 s, 673 K) to 99.9% (11.0 s, 773 K) depending on residence time and tem- perature.
The residence time of the runs ranges from 3.30 to 48.7 s, covering the gap of the literature data for the high values. The initial flow rates of H2O2/H2O and MeOH/H2O solutions are varied from 2.0 to 10.0 mL/ min and from 0.1 to 0.5 mL/min, respectively. As a result, there is significant overlap in residence times for each isotherm, allowing the reproducibility of the data to be verified.
Experiments using five different [O2]0/[MeOH]0 initial mole ratios (1.5, 1.8, 2.4, 2.7, and 3.0) at 698 K and residence times from 5 to 45 s show that conversion is independent of the initial oxygen concentration. The initial mole ratios exceeded the value of 1.5 required to fully oxidize MeOH to CO2. Thus, the reaction rate appears tobe independent of the O2 concentration over a wide concentration range. Accordingly, all experiments are conducted at a nominal [O2]0/[MeOH]0 mole ratio of 1.8.
It is very important that H2O2 be completely con- verted toO2 to ensure the reliability of the experimental results.5,16 It is determined that H2O2 is completely converted to O2 in the preheating section prior to being mixed with methanol. Using the maximum oxidizer flow rate for our experiments of 10 mL/min, the residence
time in the preheating line is approximately 7 s at 673 K. This high value of the preheating time allows a complete decomposition of H2O2 before the oxidizer and methanol are mixed.16 For lower flow rates and higher temperatures of the experiments, the H2O2 decomposi- tion has better conditions to be complete. Iodometric titrations of representative effluent samples from the oxidizer line show no residual H2O2 in solution.
The major products of the SCWO of methanol are CO and CO2. Some s mall amounts of CH4 are obtained at higher temperature and short residence times.
Our previous pyrolysis studies and the literature reported data 13 show at least an order of magnitude less methanol conversion by pyrolysis than by SCWO for comparable conditions at 773 K. Consequently, it is unnecessary to correct oxidation data for pyrolysis of methanol in the preheater and reactor, especially be- cause almost all of the oxidation runs are performed at temperatures less than 773 K.

Figure 2. Methanol conversion versus residence time: __, calcu- lated by overall first-order reaction; ..., calculated by a first-order reaction at 673 and 698 K and by a partial order reaction at 723, 748, and 773 K; experimental (▲, 673 K; ■, 698 K; ●, 723 K, ◆, 748 K; /, 773 K).
4. Global Kinetics of Methanol Oxidation
The global kinetics for SCWO of methanol may be conveniently examined by assuming that the global rate of this reaction network is proportional to the methanol concentration in the reactor at a given time and independent of the water and O2 concentrations (see experiments discussed above):
-dC 1/dt = k1C 1α (3)
For first-order kinetics, α = 1 and a plot of ln(1 - X1) versus residence time should represent a straight line at each temperature with slopes providing the rate constant
-ln(1 - X1) = k1τ (4)
Tester et al., 13 Rice et al.,5 and Brock et al.3 reported that a straight isotherm line could fit the data. In our experiments only 673 and 698 K isotherms are linear while 723, 748, and 773 K isotherms are not linear at residence times higher than 10 s (Figure 3). Accordingly, two an alyses of the data are conducted: case a and case b.
For case a, first-order kinetics are assumed for the entire temperature range. The conversion values that result from this case are displayed in Table 2 along with the average relative deviations (ARDs) related to ex- perimental data. The absolute average relative devia- tions (AARDs = jARDsj) are 9.96% at 673 K, 7.24% at 698 K, 11.6% at 723 K, 8.90% at 748 K, and 1.67% at 773 K. The larger ARDs are observed at the extremities of the residence time ranges. Figure 4 shows an Arrhe- nius plot of the overall first-order rate constant, k1, for methanol oxidation. The Arrhenius parameters for 95%

Figure 3. Plot of ln(1 - X1) versus residence time: __, fitted
straight lines of experimental values (▲, 673 K; ■, 698 K; ●, 723 K, ◆, 748 K; /, 773 K).

Figure 4. Arrhenius plot of the first-order rate constant versus 1000/T.
confidence level corresponding to k1 are A = 1011.8±0.8 s-1 (frequency factor) and Ea = 178 ± 11 kJ/mol (42.5 ± 2.7 kcal/mol). The value for the global activation energy obtained by fitting our experimental data with the first-order reaction is practically the same as that reported by Rice et al.,5 42.8 kcal/mol, but much lower than the values reported byTester et al.13 and by Brock et al.:3 97.7 ± 20 and 78.4 ± 20.1 kcal/mol, respectively.For case b, the data are separated into two groups. The data sets for the two lower temperatures are assumed to follow first-order kinetics, whereas for the higher temperatures, α is determined by best fit of the experimental data. The calculated conversions consider- ing first-order kinetics only for 673 and 698 K are presented in the fourth column of Table 2 along with much s maller ARDs than those obtained with first-order kinetics employing the data for all temperatures. For these data A = 109.15 s-1 and Ea = 143 kJ/mol (34. 1 kcal/ mol) are obtained. Considering a partial order kinetics (α ≠ 1 in eq 3) for 723, 748, and 773 K, the fitting of experimental data provides the values of α = 1.6, A = 1018.6 s-1, and Ea = 254 kJ/mol (60.7 kcal/mol). These values are closer to those of Tester et al.13 and Brock et al.3 presented above. The calculated conversions for these temperatures with the partial order rate law are also displayed in the fourth column of Table 2 along with the calculated ARDs (column 6).

Figure 5. Calculated versus experimental methanol conver- sions: 673 K, △, ▲; 698 K, □, ■; 723 K, O, ●; 748 K, ◇, ◆; 773 K, ×, /. The first and second symbols for each temperature represent calculated values using case a and case b an alyses, respectively.
The calculated conversion values for both cases a and b versus corresponding experimental data are presented in Figure 5. As discussed above, the data obtained by using different kinetic models for two temperature ranges fit the experimental data better than those obtained by using one overall first-order reaction kinetic model. If the data are considered for residence times up to ~10 s, the data may be well fitted by overall first- order kinetics as reported in the literature. However, considering the entire residence time ranges, we ob- tained two different rate-controlling steps at the two different sets of isotherms as shown later.
Columns 2-4 of Table 3 summarize all experimen- tally averaged data for the concentrations of methanol (component 1), CO (component 2), and CO2 (component 3) obtained as ratios of Ci/C 1o (i = 1-3). The methanol concentration decreases continuously with the residence time (higher rates as temperature increases). The yield of CO initially increases as the methanol conversion decreases for all studies. A maximum value is reached for data of 723 and 748 K, at which point the concentra- tion ofCO decreases. Initially, the CO2 yield is very low, but it increases rapidly as temperature increases. Because methanol oxidation proceeds globally through CO to CO2, it is useful to examine the experimental data in terms of the observed yields of CO and CO2 as a function of residence time and reaction temperature. Accordingly, the global reaction network for SCWO of methanol based on our experimental data can be written in the broadest sense as consecutive reactions:
CH3OH (1) > CO (2) > CO2 (5)
By assuming that each step in this scheme follows first- order kinetics, one can write the an alytical expressions for the concentration profiles for each component as a function of residence time:
Y 1 = 1 - X1 = C 1/C 1o = exp(-k12τ) (6)
Y2 = C2/C 1o =
k12[exp(-k12τ) - exp(-k23τ)]/(k23 - k12) (7)
Y3 = C3/C 1o =
1 - [k23 exp(-k12τ) - k12exp(-k23τ)]/(k23 - k12) (8)
详细内容请见附件
免责声明:
本页面/内容部分素材来源于互联网公 开 信 息,旨在传递更多信息,不代表本平台立场。
版权归原作者或机构所有,如涉及侵权,请通过平台联系我们,我们将在核实后第一时间处理。
本平台对转载内容的真实性、准确性不作任何保证,用户需自行判断并承担使用风险。