煤粉气化炉网络中的煤粉气化

煤粉气化炉网络中的煤粉气化(pulverized_coal_gasification_tutorial)
摘要:
本文基于 Chemkin-Pro 开展煤粉气化炉仿真,采用 PSR-PFR 反应器网络与 CPD 煤热解模型,耦合气相骨架机理与煤表面热解反应。以甲烷预混燃烧供热,在 2 atm 下模拟烟煤颗粒热解、桥键断裂与半焦交联过程,分析合成气与焦油生成规律。结果显示,热解主要发生在 PFR 段,不稳定桥键断裂释放 H₂、CH₄、CO 等轻质组分,芳核结构逐步裂解生成芘为代表的焦油。煤颗粒质量与粒径缓慢下降,结构官能团浓度变化揭示热解反应历程。该方法可清晰展现煤热解路径,为气化炉设计与运行优化提供数值工具。
2.7.6
Gasifying Pulverized Coal in a Coal Gasifier Network
2.7.6.1
Project Description
This tutorial is based on a fully configured sample project that contains the tutorial project
settings. The description provided here covers the key points of the project set-up but is not intended to explain every parameter setting in the project. The .ckprj file has all custom and default parameters already configured; the text highlights only the significant points of the tutorial.
This tutorial uses the Particle Tracking module and the coal surface chemistry model to simulate the coal devolatilization process.
2.7.6.2
Project Setup
The PSR-PFR network shown in Figure 2-1 is used as the simplest representation of a coal gasifier. A premixed methane-air mixture of equivalence ratio of 1.05 with
additional 20% N2 dilution enters the first PSR, which serves as a “firebox” to the coal gasifier. This diluted fuel-air stream is at 300 K and the mass flow rate is 100 g/s. The energy released in the firebox from the combustion of methane will heat up the
pulverized coal particles injected into the PSR immediately downstream. Methane is used in this sample project because the coal surface mechanis m does not contain
any char oxidation reaction; in addition, it is easier to interpolate the simulation results if the coal particles only experience devolatilization. The N2 dilution in the fuel stream will lower the flame temperature of the first PSR and consequently the temperature of the entire gasifier. The sole purpose of reducing the gasifier temperature is to slow down the reactions so that details of the coal devolatilization process, especially the primary devolatilization process, can be clearly identified in the main gasification
region, that is, the downstream PFR. In practical application, pulverized coal would be used as the fuel to heat up the gasifier and the additional N2 in the fuel stream would be unnecessary. A mixture of steam, N2, and coal particles are injected into PSR #2. Here they will be mixed with the hot exhaust from the firebox, PSR #1. The
temperature of the coal-feeding stream is 400 K. The mass flow rate of the gas
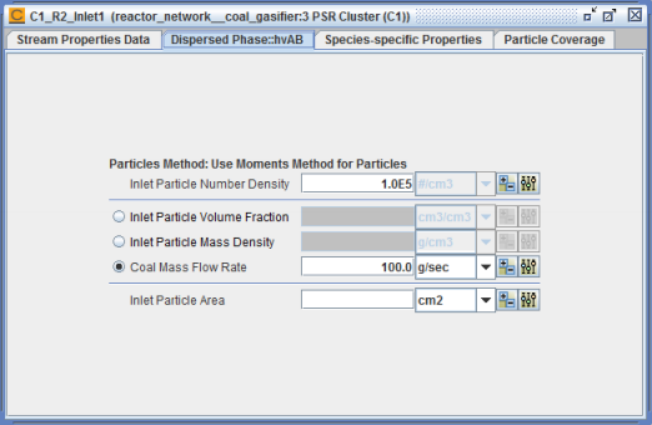
mixture is 200 g/s and the coal (solid) mass flow rate is 100 g/s. The coal particles are assumed to be at the same size. The particle number density in the inlet is 105 cm-3 . Figure 2-2 shows the Inlet Stream Properties panel where you can specify the coal mass flow rate and particle information. The mixing and heating action continues in PSR #3, with a fraction of the mixture being recirculated back into PSR #2. The
fraction of the mass recirculated depends on the configuration of the coal gasifier and the operating conditions. In this project, 10% of the exiting mass flow from PSR #3 is set to circling back to PSR #2. The PFR downstream is the primary coal gasification zone, in which most lightweight syngas species and gaseous tars are released from the heated coal particles. The operating pressure of the gasifier is 2 atm.
Figure 2-1 A PSR-PFR network as a simplified representation of a coal gasifier.
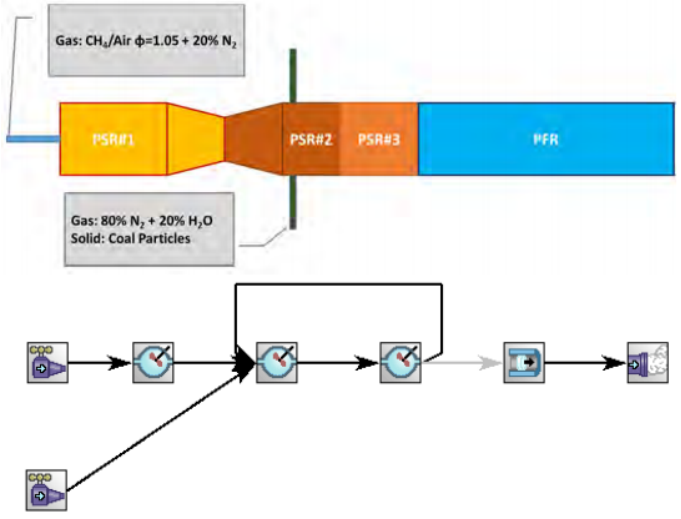
Figure 2-2 Entering coal particle number density and coal mass flow rate on the Inlet Stream Properties panel for the inlet to PSR #2. The particle volume fraction or particle mass density will be calculated internally for coal particles.
The project file, reactor_network coal_gasifier.ckprj, is located in the samples2010 directory. The gas-phase reaction mechanis m consists of a skeletal C4 combustion mechanis m, reduced from a master mechanis m for gasoline combustion, and submechanis ms for polycyclic aromatic hydrocarbons (PAHs) pyrolysis and NOx formation. The surface mechanis m is a custom-created devolatilization mechanis m for a high-volatile bituminous coal (~80% carbon and~40% volatile matter by weight, dry-ash-free). This surface mechanis m includes coal- specific Core, Labile Bridge, and Fragment functional group (FG) species, as well as coal-independent reactions for bridge activation/breakup, char cross-linking, tar flash- distillation, and light-gas desorption1,2. The rate parameters of bridge activation,
scission, and char cross-linking reactions are taken directly from the chemical percolation devolatilization (CPD) model3 . Desorption rates of light volatile gases come from an early version of functional group (FG) model by Solomon et al.4 This tutorial demonstrates the concept of the coal devolatilization process as a set of surface reactions. Note that the coal surface mechanis m in this sample project is not validated.
2.7.6.3 Project Results
The solutions from the coal gasifier reactor network are presented from Figure 2-3 to Figure 2-6, below.
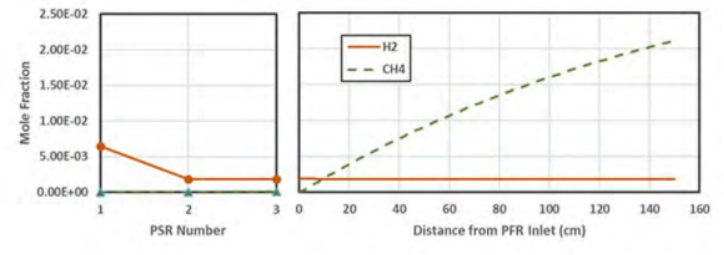
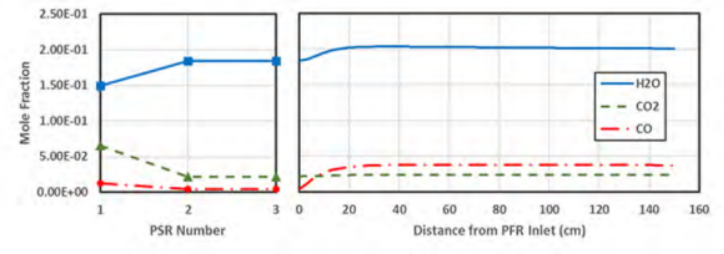
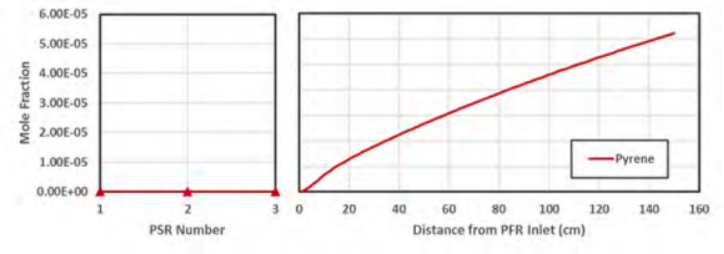
The mole fraction profiles of selected syngas components are given in Figure 2-3(a) and Figure 2-3(b). The CPD model dictates that most lightweight volatile gases can escape into the gas- phase only after labile bridges in the coal superstructure are broken by thermal cracking. Because of the short residence times in PSR #2 and PSR #3 (< 3 ms combined), only a s mall fraction of labile bridges are actually broken and the amount of syngas released is negligible, as shown by the plots on the left side of the figures. Once most bridges are severed in the upstream portion of the PFR, light gases can escape from the coal particles at different rates. Figure 2-3(C) shows the formation of the s mallest gaseous tar species from coal devolatilization. The s mallest gaseous tar species is represented by pyrene (C16H10) because there are on average
16 carbon atoms in a fused aromatic ring cluster (i.e., core) for this particular coal.
The production rate of coal tar depends on the concentrations of bridges and char links (clinkB)) in the coal superstructure. These concentrations indicate the integrity of the coal structure and are determined by the CPD model.
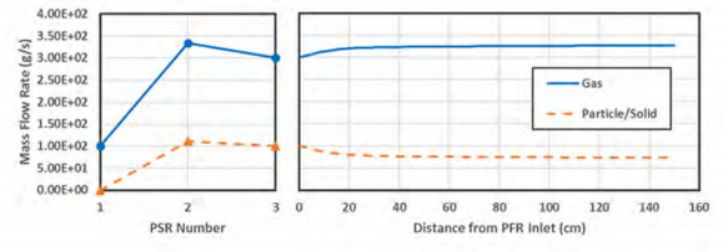
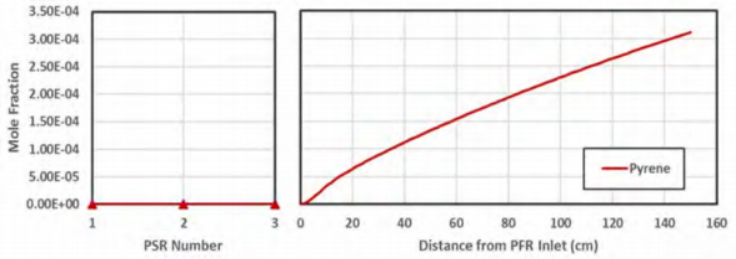
Figure 2-4(a) illustrates the mass exchange between the coal particles and the gas phase. The coal particles continually lose mass to the gas phase during devolatilization; however, the total mass flow rate (gas + particle/solid) remains constant between PSR #3 and the exit of the PFR. PSR #2 has the highest mass flow rate because of the external coal feed and flow recirculation from PSR #3. The coal mass flow rate is zero in PSR #1. The evolution of the particle size is presented in Figure 2-4(b). Because this bituminous coal has large aromatic cores and relatively sound structure, the particle size, determined mainly by the concentration of the aromatic core, decreases slightly in the absence of char oxidation. The particle size is zero in PSR #1 since no coal particle exists in that reactor.
Chemkin-Pro uses the CPD model to simulate the connectivity breakdown of the coal superstructure (coal pseudo-lattice) due to thermal cracking. Macromolecules serving various structural functions in the coal lattice are represented by a set of structural functional group (FG) species. The fused aromatic-ring cluster that makes up the bulk
of coal char is characterized as the node/site of the lattice structure and is denoted by the “Core” FG species. The weak molecular structure connecting the nodes of the
coal lattice is the bridge and is modeled by the “Labile Bridge” FG species. The
Activated Bridge FG species represents the bridge that is ready to collapse
(disconnecting the nodes) or to forge a strong link, denoted by the FG species Char Link (clinkB)), between the nodes (cross-linking). The consumption of the Activated Bridge FG species will also unlock volatile-gas precursors embedded in the molecular structure; these volatile-gas precursors will later be released individually into the gas phase by desorption. A schematic of the labile bridge scission reaction sequence is depicted in Figure 2-5. Accordingly, the activities within the coal superstructure can be manifested by the transformations of those structural FG species.
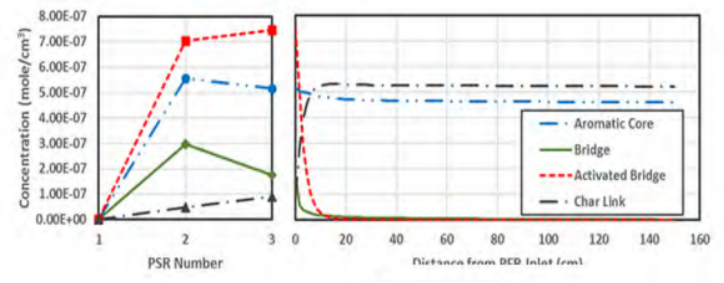
In Chemkin-Pro, the FG species solutions are labeled as Bulk Activity. In the PSR model, the FG species activity has a unit of mole. However, the FG species activity from the PFR model is given as mole/cm. In order to compare the FG species solution from these two reactor models, the molar concentration of the FG species (mole/cm3) is used. The FG species molar concentration can be derived by dividing the FG activity solution from the PSR model by the reactor volume, assuming the coal particles are homogeneously suspended in the gas. Similarly, the FG activity solution from the PFR model can be converted into molar concentration by dividing the activity by the cross-sectional area of the Plug Reactor.
In addition, the Labile Bridge (lbrdg(B)), the Activated Bridge (lbrdg*(B)), and the Char Link (clink(B)) FG species used in the coal surface mechanis m actually represent a number of labile bridges, activated bridges, and char links, respectively, in the real coal. The predicted concentrations of Bridge (lbrdg(B)), Activated Bridge (lbrdg*(B)), and Char Link (clink(B)) FG species should be multiplied by a scaling factor, which is the model-to-actual bridge molecular weight ratio. The molecular weight of the model Labile Bridge FG species can be found in the surface chemistry output file; the molecular weight of the actual bridge molecular structures is given by the MWBRIDGE keyword in the coal surface mechanis m. In this case, the model
bridge/link scaling factor is 733.25/58.65 = 12.5 (i.e., 1 Bridge in the model equals 12.5 bridge structures in the real coal).
Figure 2-6 indicates that the Core (core(B)) concentration drops during devolatilization. In other words, the coal lattice is losing nodes. Without oxidation, the Core (core(B)) can only be converted into s mall aromatic fragments by bridge scission, meaning that s mall blocks of the nodes break free from the main coal lattice. These fragments will subsequently become liquid tars on the surface of the coal particles and eventually gaseous tar species (pyrene (a4) in this example). This chain of events also explains the slight delay of major gaseous tar release in Figure 2-3(c).
The Bridge (lbrdg(B)) scission reaction sequence of the CPD model is clearly
revealed by the progressions of bridge/link FG species concentration in Figure 2-6.
The Labile Bridge (lbrdg(B)) is first activated by the hot exhaust and starts to
decompose or to form char links (clinkB)) in PSR #2 and PSR #3. The Bridge
(lbrdg(B)) scission continues into the PFR until all the Activated Bridge (lbrdg*(B)) FG species is consumed. Parallel to Bridge destruction, char links are formed to provide additional support to the coal lattice according to the CPD model. Note that there is a s mall fraction of Labile Bridge that never gets activated. This is due to the Labile
Bridge activation reaction’s distributed activation energy, which is not a constant. A clipped Gaussian distribution is used to mimic the different strengths of the diverse molecular structures represented by the Bridge FG species. The Bridge molecular
structures with the lowest activation energy (i.e., the weakest) will be activated and broken first. As the devolatilization process continues, the effective activation energy will increase to reflect the strong Bridge structures remaining in the coal lattice.
Therefore, unless the temperature is high enough, some of the strongest Bridges will survive and stay intact in the coal lattice.
Figure 2-3 Mole fraction profiles of major syngas species (a) & (b); and gaseous tar species (c).
 (a)
(a)
 (b)
(b)
 (c)
(c)
Figure 2-4 Predicted profiles of gas and coal particle mass flow rates (a); and the average coal particle diameter (b).
 (a)
(a)
 (b)
(b)
Figure 2-5 Schematic of the labile bridge scission sequence of the CPD model.
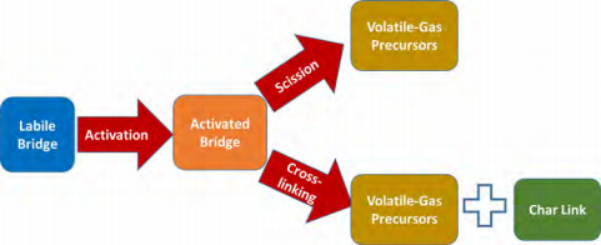
Figure 2-6 Predicted concentration profiles of coal structural Functional Group Species: Aromatic Core (core(B)), Labile Bridge (lbrdg(B)), Activated Labile Bridge (lbrdg*(B)), and Char Link (clink(B)). The scaling factor for model bridge/link FG species is 12.5.
免责声明:
本页面/内容部分素材来源于互联网公 开 信 息,旨在传递更多信息,不代表本平台立场。
版权归原作者或机构所有,如涉及侵权,请通过平台联系我们,我们将在核实后第一时间处理。
本平台对转载内容的真实性、准确性不作任何保证,用户需自行判断并承担使用风险。