FEMFAT4.7 疲劳强度评估核心方法与影响因子

摘要:
本文为 FEMFAT 4.7 疲劳强度评估核心理论手册,系统阐述基于 Miner 线性累积损伤准则的疲劳寿命计算方法。手册以局部构件 S‑N 曲线为核心,通过应力梯度、平均应力、表面粗糙度、表面强化、温度、统计、工艺参数等多因子修正,结合临界切面法处理多轴应力状态。采用 Neuber 准则考虑局部塑性与平均应力重分布,提供 Haigh 图、雨流计数与损伤等效数据压缩功能,覆盖钢、铸铁、铝镁合金等材料。完整给出 S‑N 曲线三参数(疲劳极限、斜率、循环极限)计算流程,为有限元节点疲劳强度精准评估提供完整理论与算法支撑。
Contents
MAGNA POWERTRAIN
CONTENTS 1
NOTATION AND ABBREVIATIONS 2
1 INTRODUCTION 4
2 THEORETICAL BASIS 6
2.1 LOCALPLASTIFICATION 8
2.2 THE STRESS MECHANICS SERIES INFLUENCE 9
2.3 OPERATIONAL STRENGTH OF COMPONENTS 10
3 THE SYSTEM OF S/N CURVES 11
3.1 INFLUENCE OFTHE STRESS GRADIENT 12
3.2 THEHAIGH DIAGRAM 17
3.3 THE CRITICAL CUTTNG PLANE METHOD 19
3.4 THE MEAN STRESS INFLUENCE ON THE LOCALCOMPONENT S/NCURV 22
3.4.1 The mean stress influence on the endurance stress limit 22
3.4.2 Mean stress influence on the slope of theS/N curve 25
3.5 THE TECHNOLOGICALINFLUENCE OF STANDARDS 31
3.5.1 The surface roughness influence factor 31
3.5.2 The influence factors ofsurface treatments 34
3.5.3 Influence of tempering condition 41
3.6 OTHER INFLUENCE FACTORS 42
3.6.1 The technological parameter influence 42
3.6.2 The thermal influence factor 46
3.6.3 The statistical influence factor 48
3.7 THE SUPERPOSTTION OFINFLUENCE FACTORS 49
3.7.1 The endurance stress limit of the local componentS/N curve 49
3.7.2 The slope of the local componentS/N curve 50
3.7.3 The endurance cycle limit of the local componentS/N curve 50
4 BIBLIOGRAPH 51
Notation and abbreviations
IFK2 Slope exponent of the incipient fracture S/N curve
IFK3 Material group-dependent exponent
f1,af Combined factor for surface roughness and degree of forging influencing the
endurance stress limit
f2,af Combined factor for the technological treatment of surfaces influencing the
endurance stress limit
ftot,af Overall factor influencing the endurance stress limit
fGS,af General surface factor influencing the endurance stress limit
fTI,af Temperature-dependent factor influencing the endurance stress limit
fTP,af Technological parameter influencing the endurance stress limit
fm,af Mean stress factor influencing the endurance stress limit
fm,sf Mean stress factor influencing the slope
fm,cf Mean stress factor influencing the endurance cycle limit
fGR,af Stress gradient factor influencing the endurance stress limit
fGR,sf Stress gradient factor influencing the slope
fGR,cf Stress gradient factor influencing the endurance cycle limit
fsT,af Statistical factor influencing the endurance stress limit
fDF,af Factor of the degree of forging(can be defined by user)influencing the endurance
stress limit
fsR,af Surface roughness factor influencing the endurance stress limit
fsP,af Shot peening factor influencing the endurance stress limit
fRO,af Rolling factor influencing the endurance stress limit
fCH,af Carburizing factor influencing the endurance stress limit
fNI,af Nitriding factor influencing the endurance stress limit
fcN, af Carbonitriding factor influencing the endurance stress limit
fH,af Induction hardening factor influencing the endurance stress limit
fFH,af Flame hardening factor influencing the endurance stress limit
Kc Slope of the local component S/N curve KM Slope of the material S/N curve
Ncf,M Endurance cycle limit of the material S/N curve
Ncf,C Endurance cycle limit of the local component S/N curve
OUTS Ultimate tensile stress
Oy 0.002 strain offset yield strength of the material
σ Local stress
Oaf,C Endurance stress limit of the local component S/N curve
OA,tsc Material alternating stress limit for tension/compression
OA,b Material alternating stress limit for bending
T Local shear stress
TF Shear yield point
TA,to Alternating stress limit(shear stress)under torsion
Xmax Absolute stress gradient
X' Relative stress gradient
a Amplitude* m Mean stress* u Upper stress*
1 Lower stress*
e Equivalent stress*
af S/N curve endurance stress limit* sf Slope of the S/N curve*
cf S/N curve endurance cycle limit*
* Recurring indices
1 Introduction
Estimates of fatigue life are made using FEMFAT by means of the influence factors method for the technical incipient fracture criterion.S/N curves are calculated at the FEM nodes from the material strength data.These S/N curves are influenced by the local component properties,the prevalent stress conditions and,in particular,the stress gradient.The program is based on our own experience and methods,and the methods described in the former TGL19340 and the FKM Guideline [FKM94]for determining influence factors.By comparing the external stresses and the operational strength of the component,the lifetime of the component can be estimated on the basis of the linear hypothesis of damage accumulation after Miner [MINER 45]).
The FEMFAT BASIC program uses the load spectrum as the external stress,similar to the concept of nominal stress.The treatment of the various stress relationships(Ri,Oai)in the individual load spectrum stages is performed in FEMFAT by determining the local component SN curve corresponding to the respective stress relationship(Ri,Oai)
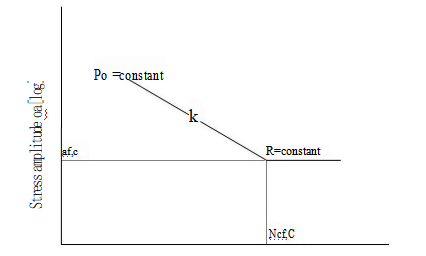
Fig. 1.1 Schematic representation of a component S/N curve
A local component S/N curve,such as that shown in Fig.1.1,is described in a log-log plot by the following three parameters:
● the endurance stress limit σaf,C;
·the endurance cycle limit Nef,c and;
·the slope kc.
The main purpose of the influence factors method is to determine these three parameters in terms of the unique "Iocal conditions".The method therefore emphasizes placing the parameters into the correct functional relationship to each other,see Equations 1.1,1.2 and 1.3.
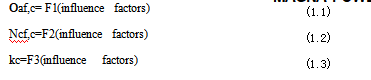
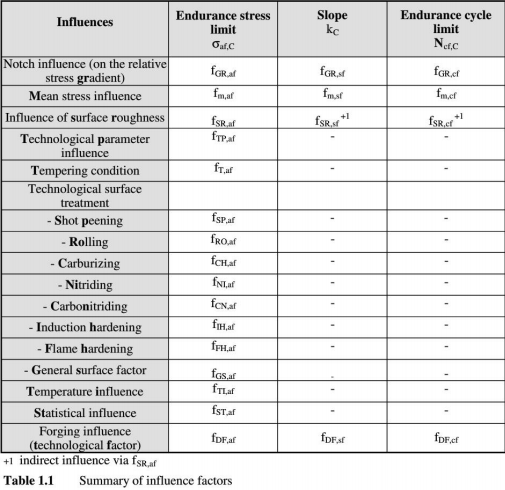
Table 1.1 shows the influence factors that can be taken into consideration in FEMFAT. Their influence on the local component S/N curve is explained in the following sections in order to provide the user with an overview of the most important theoretical fundamentals of the basic module.More detailed information can be taken from the appropriate cited literature.
2 Theoretical basis
The Miner linear damage accumulation hypothesis [MINE45]forms the basis for almost all known methods of estimating fatigue life in operational situations (Equation 2.1).
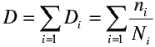 (2.1)
(2.1)
The damage contribution of a stress cycle of a random stress with the stress amplitude Sai and mean stress S mi is given as the reciprocal of the number of cycles that can be measured(Di=1/N;) under the same stress and operating conditions as for an S/N test Ni=N(Sai,S mi).The individual damage contributions are totalized in the course of the fatigue life estimate.When a damage total D=1 is reached,component failure occurs.
The stress amplitude Sa and the mean stress S m can,for example,be defined as the nominal or local stress.Accordingly,these concepts are known as the nominal stress concept or principal of local strains. In FEMFAT, these are the local elastic stresses,and can be determined from the external stress by means of a structural elastic FEM an alysis of each component.
The structural elastic FEM ana lysis can be carried out using a unit load.Because of the linear relationship,the external stress,given as load spectra(stepped load spectra,synthetic load spectra) or a rain-flow matrix,can be directly transformed into the local elastic stresses of an FEM node. This makes the relatively time-consuming notch base stress simulation unnecessary.Any local plastification occurring,and the resulting series influence caused by stress mechanics processes, must therefore be dealt with separately.
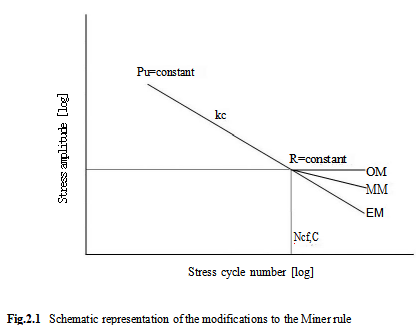
The following modifications to the original Miner rule(OM)can be used in FEMFAT in order to deal with the damaging effects of stress cycles below the endurance stress limit of the component S/N curve:
·The elementary Miner rule(EM).Using the elementary Miner rule,the creep strength domain SN curve with slope k is extended until the stress amplitude oa=0.
·The modified Miner rule(MM).Below the endurance stress limit oE,the modified Miner rule proposed by Haibach [HAIB 83]employs a fictitious extension to the creep strength domain with a slope 2k-1.
2.1 Local plastification
Whenever the local stress exceeds the material's yield stress,local plastification occurs,which is considered by FEMFAT in ana logy to the principal of local strains.The first stress-curve is adopted as the history for all stress cycles.The displacement of the closed hystereses loops caused by the local plastification is then taken into consideration. Fig.2.1.1 schematically shows this procedure.Transformation of the local elastic stress to the elastic-plastic stress is given by the Neuber rule [NEUB 61].
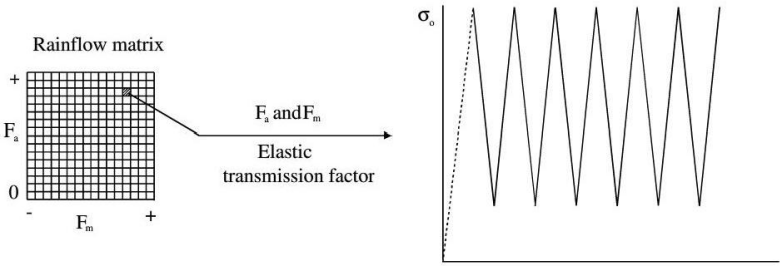
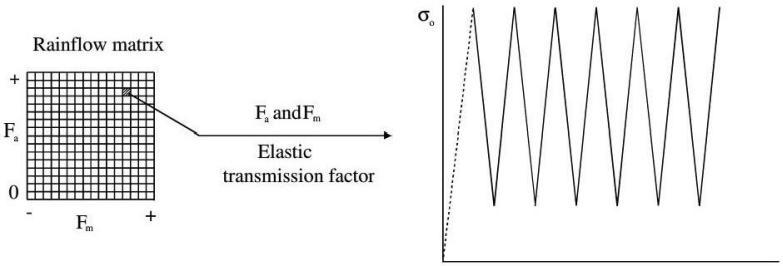
Fig.2.1.1 Schematic representation of the mean stress redistribution
2.2 The stress mechanics series influence
Load spectra describe the size and frequency of the stress cycles expected during the design working life of a component.A load spectrum does not contain any information on the sequence of occurrence of individual stress cycles. FEMFAT therefore attempts to limit the effects of the stress mechanics series influence by assuming so-called "favorable"and "unfavorable"series. Matrix elements with mean compressive stresses and mean tensile stresses are differentiated(Fig.2.2.1).
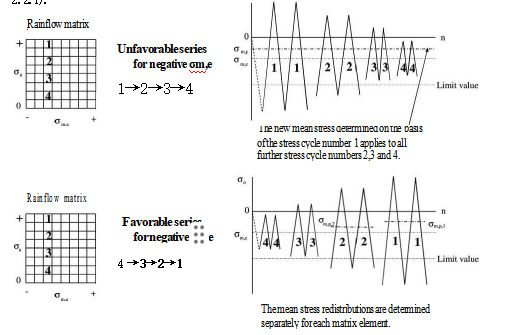
Fig.2.2.1 Schematic representation of the stress mechanics series influence
It can be easily seen in Fig.2.1.1 that the "favorable"or "unfavorable"effect of the stress mechanics series influence for a mean tensile stress is the reciprocal of that for a mean compressive stress.
2.3 Operational strength of components
Use of the elastic local stress for damage assess ment requires that the component operational strength be according locally formulated.
Therefore,the corresponding local component S/N curve for the FEM node under consideration is determined in FEMFAT for each element of the load matrix,characterized by load amplitude and the mean load,from the material operational strength taking existing influences on the component into consideration (see Fig.2.3.1).
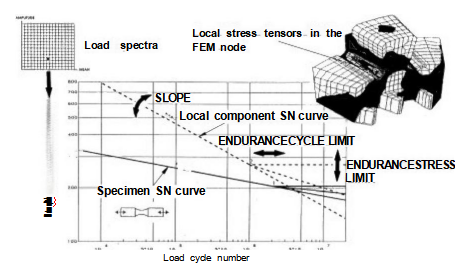
Fig.2.3. 1 Determination of the local component S/N curve
Because determination of the local component S/N curve plays a central role in the basic module, this procedure will be described in detail in a separate section entitled "The system of S/N curves".
3 The system of S/N curves
The theories and methods upon which FEMFATis based are:
·The basic method of the concept of nominal stress (load spectra,Haigh diagram,linear hypothesis of damage accumulation after Miner and its modifications).
·The procedures for determining the influence factors and for taking into account their effects on the fatigue behavior of a component,an alogous to TGL19340,the FKM Guideline [FKM 94]and the synthetic system of S/N curves [HUCK 83].
● The method for determining the critical cutting plane [FEM 2][EICH95].
Just as is the component S/N curve in the nominal stress concept,the local component S/N curves of the FEM nodes are a central element of FEMFAT. The estimates for these S/N curves therefore have a critical influence on the fatigue life an alysis. Fig.3.1 schematically shows the influences to which a component S/N curve may be subject.
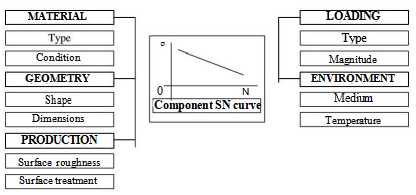
Fig.3.1 Influences on a component S/N curve
The critical component operational strength influence parameters are shape,material properties, mechanical and thermal loading affecting the component,environmental conditions and the initial conditions corresponding to the component production influences.The quality of the fatigue life an alysis depends heavily on how precisely the influence parameters can be recorded and estimated,either by employing the concept or by the methods implemented in the program.
One of the principal tasks of FEMFAT is to describe these parameters using tried and tested methods and to incorporate them into the estimate of the local component S/N curves.In the following Sections 3.1 to 3.6 the effects of the individual influencing factors are explained.The superposition of all influencing factors is the topic of Section 3.7.
3.1 Influence of the stress gradient
The aim of calculating support factors for the finite element evaluation is to automatically record the notch influence occurring in components with regard to damage effectiveness.This allows a component strength assess ment,based on reference material data for unnotched specimens [EICH 89].
A concept developed earlier by Siebel and collaborators [SIEB 48][SIEB49]combined the influences of the stress concentration factor,the stress type,the size of the component,and the effect of notch geometry on the notch factor by formulating the universally applicable hypothesis of the micro support effect,which occurs in the endurance stress limit range.It is assumed here that the existence of a stress gradient,whether caused by a stress concentration at a notch and/or by bending and torsion,causes the elements below the material surface to support the elements at the surface enduring higher stresses.This explains why,for example,s mooth bending specimens always display a higher endurance stress limit than s mooth,axially stressed specimens.
This support effect is determined in FEMFAT by means of the relative stress gradient x. The equivalent Mises stresses ov of the respective nodes in the FEM structure are calculated for this purpose and then the mean formed.Calculation of the stress gradient is performed using Equation 3.1.1 for each element between neighboring nodes.
 (3.1.1)
The result is the maximum stress gradient Xmax(regardless of direction)at each node.The corresponding relative stress gradient x'is then derived using Equation 3.1.2.
 (3.1.2)
The following methods of recording the "support effect"or the support factor are implemented in
FEMFAT:
·Stieler's method,see TGL19340.
● The IABG method [HUCK83].
● The FEMFAT method.
According to Stieler,the support factor is a function of the relative stress gradient and the material yield stress.
 (3.1.3)
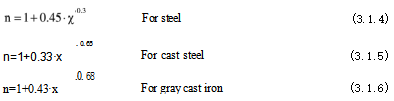
The support factor for three material groups is given in [HÜCK 83];it has been calculated on the basis of a statistical set of about 600 S/N curves with different notch forms.See equations 3.1.4, 3.1.5 and 3.1.6.
A model (Equation 3.1.7)was proposed in [EICH 89],which well described the ratio of the cyclic compressive-tensile strength to the cyclic flexural fatigue strength;it was used to calculate the support factor n or fGR,af.
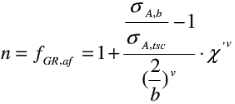 (3.1.7)
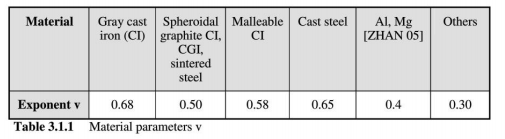
Here,σA,b represents the material alternating stress limit for bending and σA,tsc the material alternating stress limit for tension/compression.The material parameter v takes into consideration the non-proportional increase in the support effect with regard to the stress gradient x.It can be seen that,in the case of a s mooth specimen under flexural load with a diameter d=b,the parameter fGR,af exactly represents the ratio of the cyclic flexural fatigue strength to the cyclic tensile/compressive strength.The cyclic tensile/compressive strength σA,tsc is multiplied by the
factor fGR,af to determine the endurance stress limit of the local component S/N curve. The material parameters v are summarized in Table 3.1.1.
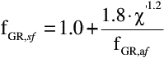
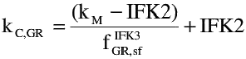
The influence of the relative stress gradient on the slope kc,GR of the local component S/N curve is determined using Equations 3.1.8 and 3.1.9,and on the endurance cycle limit Nef,C,GR using Equations 3.1.10 and 3.1.12,in a similar manner to the synthetic system of S/N curves after [HUCK 83].
 (3.1.8)
 (3.1.9)
fGR,sf Stress gradient influence factor affecting the slope of the local component S/N
curve
kc,GR Slope of the local component S/N curve as a result of the gradient influence
kM Slope of the material S/N curve at R=-1
IFK2 Slope exponent of the incipient fracture S/N curve
IFK3 Material group-dependent exponent
The following values for IFK2 and IFK3 were assumed in FEMFAT afte r [HUCK 83] and [ZHAN 05],see Table 3.1.2.

Table 3.1.2 Material parameters
For cast steel:
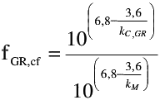
Ncf,C,GR=Nc,MfGR,cf (3.1.10)
Nef,C,GR Endurance cycle limit of local component S/N curve as result of gradient influence
Ncf,M Endurance cycle limit of the material S/N curve at R=-1
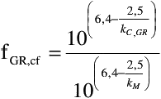
fGR,cf Gradient influence factor affecting the endurance cycle limit of the local
component S/N curve
 (3.1.11)
For other materials:
Ncf,C,GR=Ncf,MfGR,f (3.1.12)
 (3.1.13)
The influence of the stress gradient on the local component S/N curve is described with the aid of these equations.It can be recognized that slope exponent kc of the local component S/N curve influences the endurance cycle limit.
The following diagrams show the effect of the relative stress gradient on the local component S/N curve for various materials.
Fig.3.1.1 Influence of gradient on the endurance stress limit of the local component S/N curve
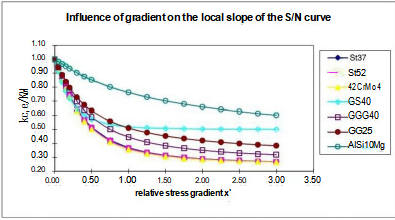
Fig.3.1.2 Influence of gradient on the slope of the local component S/N curve
详细内容请见附件
免责声明:
本页面/内容部分素材来源于互联网公 开 信 息,旨在传递更多信息,不代表本平台立场。
版权归原作者或机构所有,如涉及侵权,请通过平台联系我们,我们将在核实后第一时间处理。
本平台对转载内容的真实性、准确性不作任何保证,用户需自行判断并承担使用风险。