FEMFAT LAB 培训教程:基础操作与虚拟迭代全流程

FEMFAT LAB Training
Content
Basics
Data Processing for VI
Additional Features
Virtual Iteration
1. Basics
Enable - disable toolbar, explorer, status bar
Lesson:
• Start: FEMFAT-Lab
• Enable toolbar, explorer, status bar
• Discuss mainframe and menus
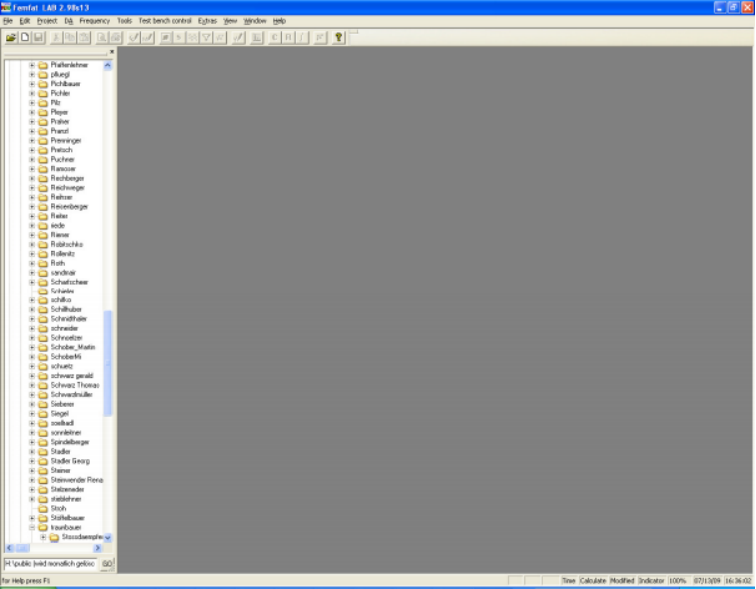
Figure 1: Mainframe
Select company logo
Lesson:
• Start: FEMFAT-Lab
• Menu: extras – options
• Choose tab general
• Select bitmap
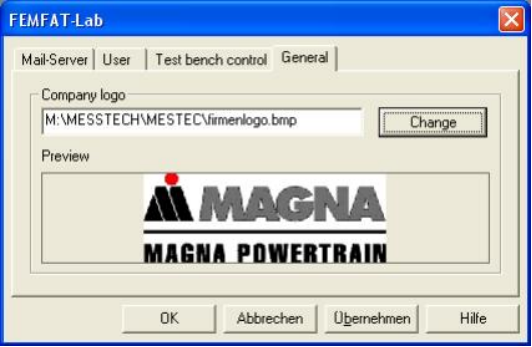 Dialog 1: Change company logo
Remark:
This menu is only available in case of “no file opened
Menus are different in case of
o No file opened
o Different file formats (RPC etc)
o Different file types (time, counting…) Discuss rest of settings!
Discuss rest of settings!
Open a file (time domain)
Lesson:
• Start: FEMFAT-Lab
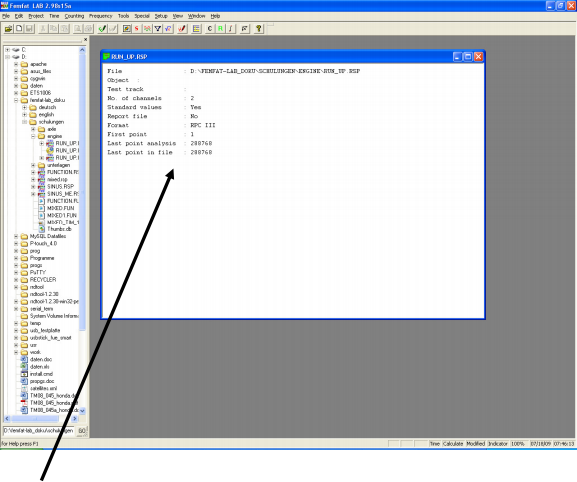
• Open the file using the explorer or menu
• ...\engine\run_up.rsp
Remark:
Short Information about file and file format is displayed
Discuss the information displayed
Discuss difference single file – project file
Working with the grid
Start:
Open file ...\general\grid.rsp
Menu: tools – header edit
Toolbar:
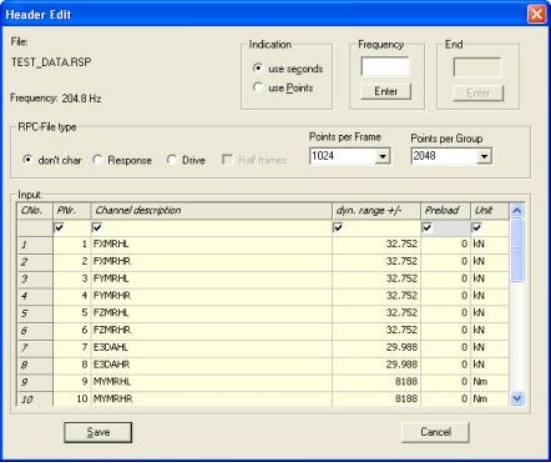
Dialog 2: Header edit
Lesson:
• Edit channel description
• Change dyn. range for channel 23-26 to 40
• Change tab “orientation” with help of CTRL T
• Use copy and paste with Excel
Edit settings for a time domain file
Menu: file - settings
Toolbar:
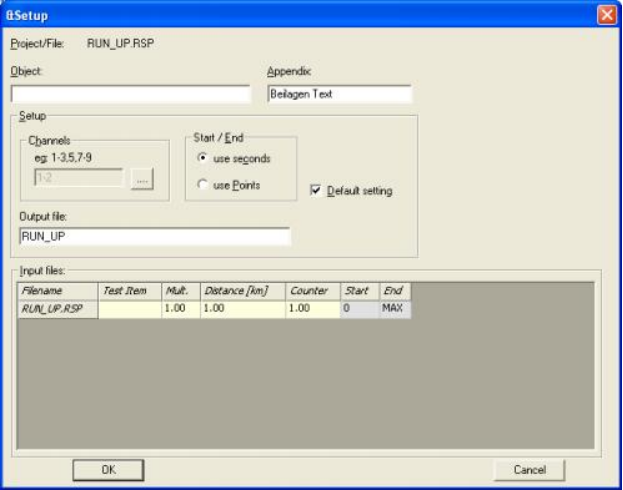
Dilog 3: General setting for data ana lysis
Following items can be edited:
• Number of channels
• Time
• Description
• Multiplication factor for rainflow-counting and damage calculation
Remark:
Discuss the information displayed
Modify setup of a file
Lesson:
• Define channel one for an alysis
• Define time for an alysis from 10-30 sec
• Multiplication factor of 111
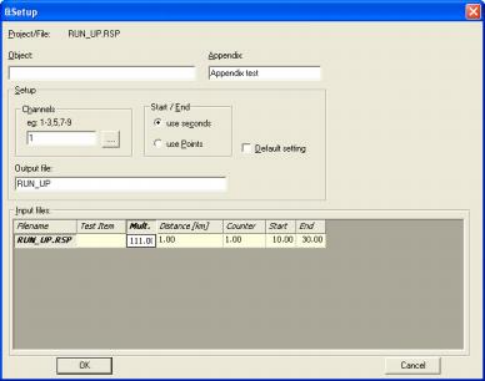
Dialog 4: Modify setup
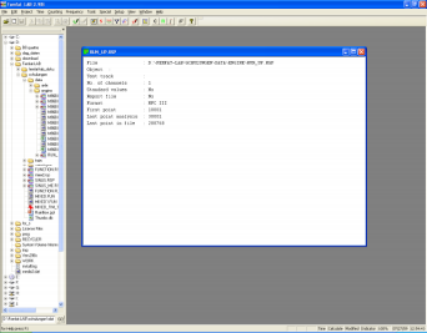
Figure 3: Mainframe
Remark:
Information has changed in main-window. Settings cannot be saved for single file (closing file or FEMFAT-Lab will cause a loss of changes)
Create a project
Lesson:
• Create a project including one file (Run_up.rsp)
• Define time for an alysis from 10-30 sec
• Multiplication factor of 111
Toolbar or menu: project – new (Ctrl-N)
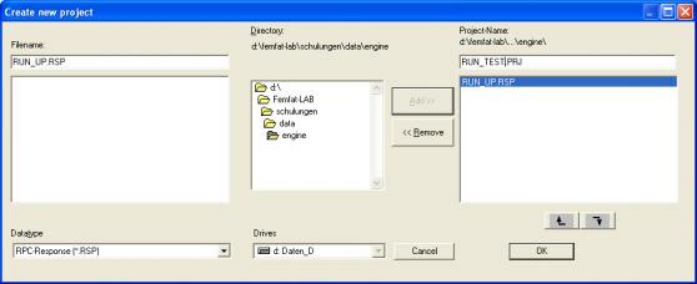
Dialog 5: Create new project
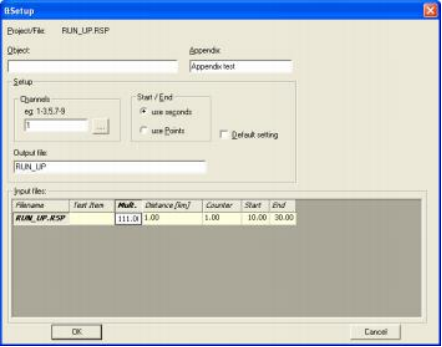
Dialog 6: Modify setup
Remark:
All Settings can be saved
Files must have same number of channels and must be located in the same directory! All calculations will be done for all files in the project!
Display a file in time domain (time plot)
Lesson:
• Display two channels of opened file in time domain
• Toolbar
• Menu: Time – time-plot
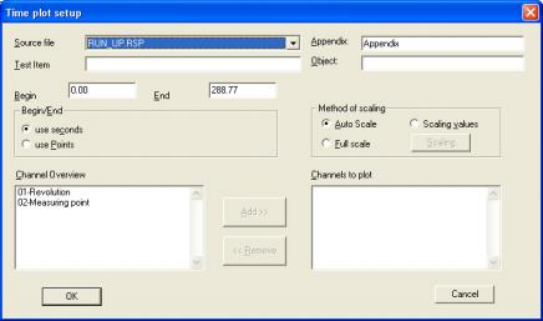
Dialog 7: Select 2 channels for time plot
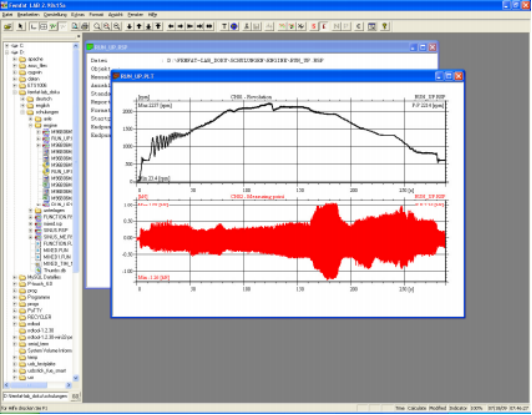
Figure 4: Result of time plot
Create a RPC response file (mixed.rsp) with waveform generator
Lesson:
• Create 3 channels
• Sinusoidal, amplitude 8.0 offset 1.5 Volt
• Triangle amplitude 8.0 offset - 1.5 Volt and
• Rectangle signal amplitude 8.0 offset 2.0 Volt
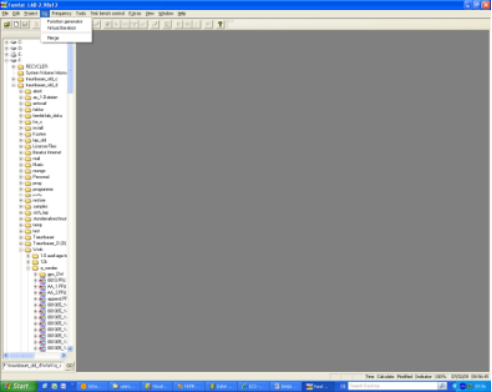
Figure 5: Start waveform generator
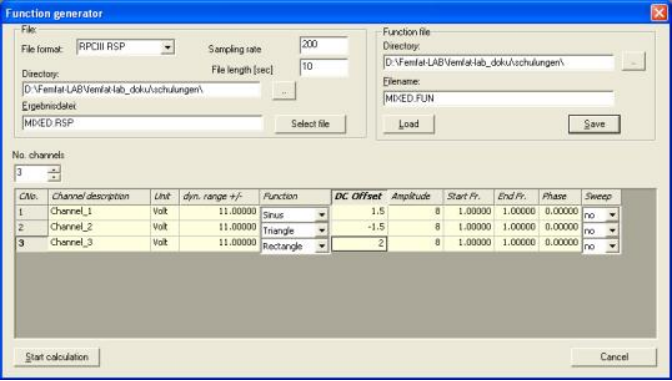
Dialog 8: Waveform generator (setup)
ChanNo Channelname T-Unit dyn.Range Function
1CHANNEL_ 1 Volt 11.00000 CHANNEL_ 1;8.000000;1.500000;0.000000;1.000000;1.000000;0;0;1;0;
2CHANNEL_2 Volt 11.00000 CHANNEL_2;8.000000;-1.500000;0.000000;1.000000;1.000000;1;0;1;0;
3CHANNEL_3 Volt 11.00000 CHANNEL_3;8.000000;2.000000;0.000000;1.000000;1.000000;2;0;1;0; Figure 6: Example for *.FUN File
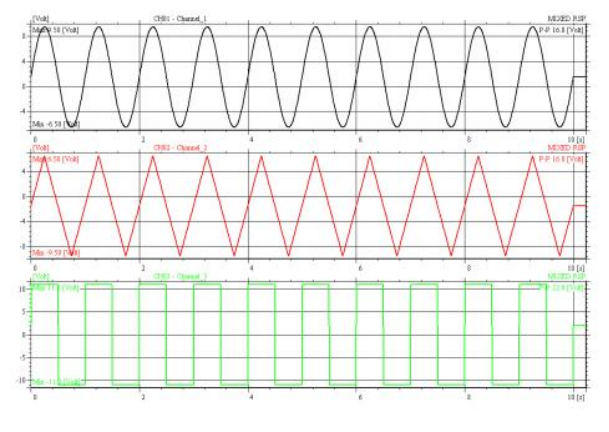
Figure 7: Time plot
Remark:
Function is stored in an ASCII-File and can be used several times
Create 2nd File with waveform generator (open already defined function) with 4 channels
Lesson:
• All 4 channels sinusoidal
• First 3 channels same setting as above
• 4th channel amplitude +/-10 no offset
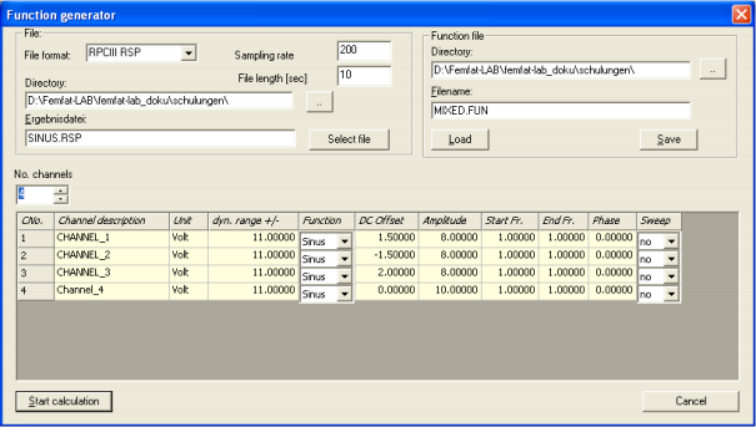
Dialog 9: Waveform dialog
Remark:
With help of the waveform generator you are able to create various signals also using phase relationship
Merge two files (mixed.rsp and sinus.rsp)
Lesson:
• Merge two files (mixed.rsp and sinus.rsp)
• The new file named result.rsp and create a new file with 5 channels (sinusoidal waveform all channels)
• Menu: DA - merge
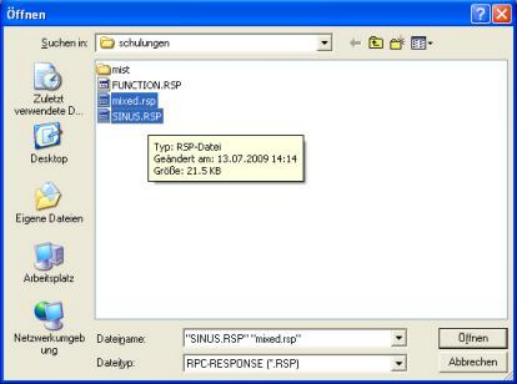
Dialog 10: Merge input dialog (open file)
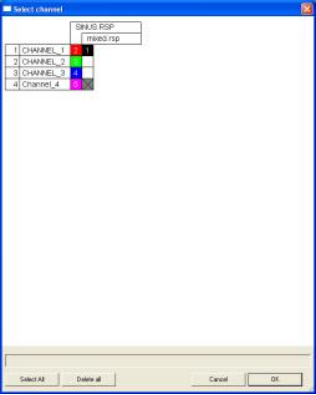
Figure 8: Merge dialog – definition of used channels
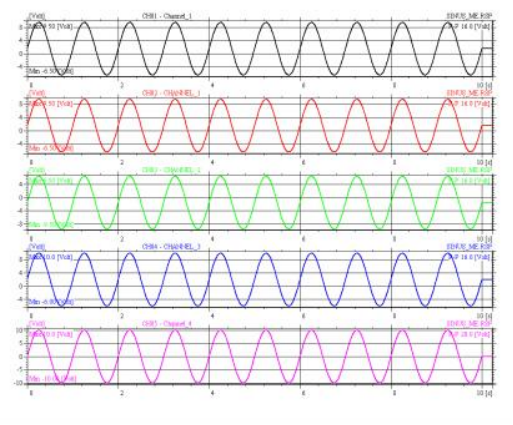
Figure 9: Time plot of result file
Remark:
Merge is also available in project-menu
Calculate statistics
Lesson:
• Open file Sinus_ME.RSP
• Calculate statistics
• Output to monitor and Excel
• Menu: time – statistics
• Toolbar
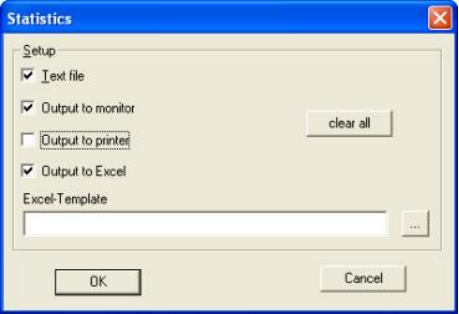
Dialog 11: Definition of statistics output
Remark:
Excel-output is only possible if Excel is installed.
Excel output is tested with Excel 2003 and Excel 2007.
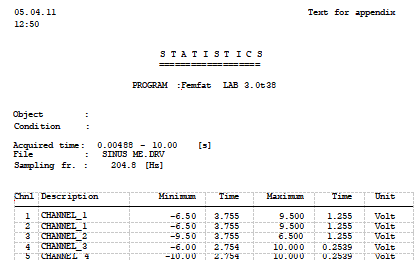
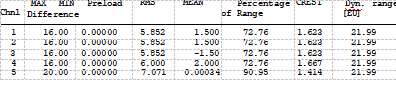
Figure 10: ASCII-output of statistic
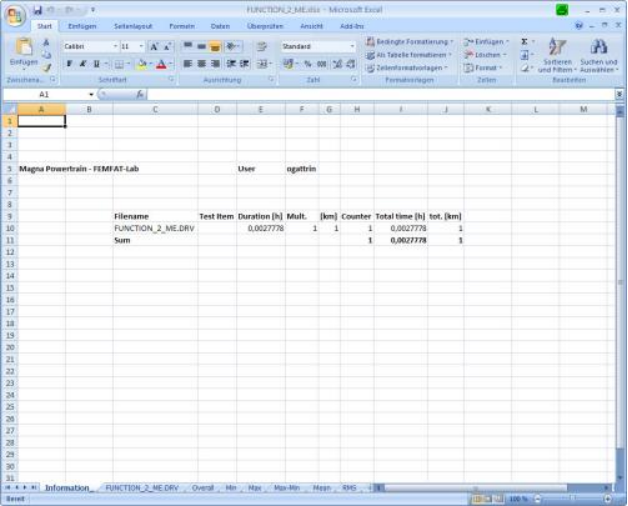
Figure 11: Screen shot of Excel-output
Remove mean, offset or center signal
Start:
Menu: time – remove mean
Lesson 3:
Open file: …\VI\Data_FIL_R500.rsp Remove offset of all channels
Menu: time – remove mean
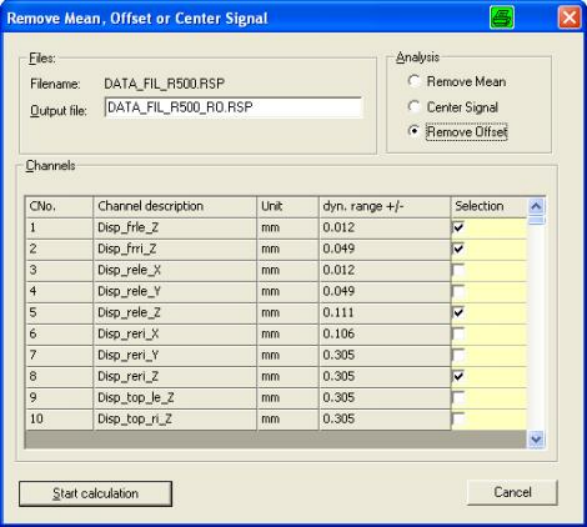
Dialog 12:Remove offset
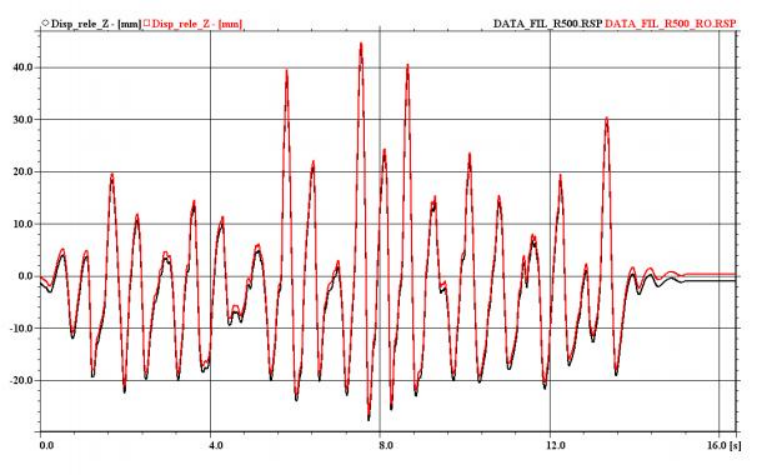
Figure 12: Displacement rear left, offset removed
Remark:
Three methods are available
Remove mean (subtract mean-value)
Center signal (get symmetrical signal)
Remove offset (offset of first measuring point)
Simple data extending (time domain)
Start:
Menu: time – insert data points
Lesson:
Open file: … \axle\brake.rsp
Insert data point 2 after each point (region 3800-4800)
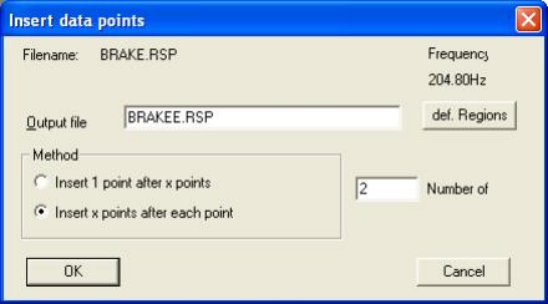
Dialog 13: Insert data points
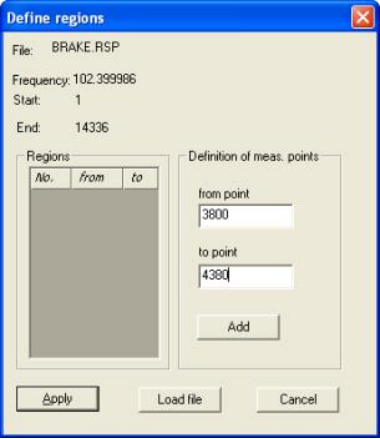
Dialog 14: Insert data points for a specified regio
Check the result with help of time plot
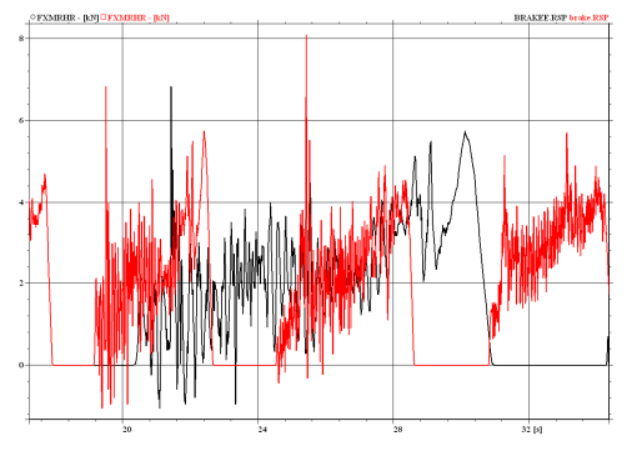
Figure 13: Comparison of extended and original file
Remark:
To increase number of points only in a region may be used for test bench, if there is a performance problem!
详细内容请见附件
免责声明:
本页面/内容部分素材来源于互联网公 开 信 息,旨在传递更多信息,不代表本平台立场。
版权归原作者或机构所有,如涉及侵权,请通过平台联系我们,我们将在核实后第一时间处理。
本平台对转载内容的真实性、准确性不作任何保证,用户需自行判断并承担使用风险。