NFX|电力隧道拓扑优化

Optimizing the structural cross-sections of power tunnels based on variations in geological strata and burial depths of the power tunnels is essential for their long-term operational safety and maintenance.In this study, the topology optimization theory and finite element methods were applied to derive volume constraints for power tunnels using a straight-wall arch tunnel as an example. Consequently,a topology optimization model for power tunnel structures was established, and the structural characteristics of power tunnels were optimized and an alyzed under varying burial depths and elastic mod uli using the variable density method. The results indicate that the overall profile of the optimized power tunnel transforms from a straight-wall arch to a multi-centered circle. With the increase in the elastic modulus of the surrounding strata, the internal net height and height-to-span ratio of the tunnel generally show an increasing trend, while the external wall span, vault thickness, invert arch thickness, side wall thickness, and upper arch curvature generally show a decreasing trend. Compared to the elastic modulus of the strata, the burial depth has a relatively s maller impact on the structural profile of the power tunnel. Therefore, when conducting related designs for power tunnels, more emphasis should be placed on understanding the geological conditions of the strata. Subsequently,using the design principles of topology optimization, the power tunnel structure was optimized and a two-dimensional model was developed, incorporating stratigraphic characteristics of the power tunnels. Changes in the bending moment, axial force, safety factor, and other indicators were compared before and after optimization. The results demonstrated that the overall safety performance of the power tunnel lining structure improved notably after optimization, verifying the feasibility of applying topology optimization to power tunnels. These research findings provide valuable reference data for the optimization of power tunnel engineering designs.
Keywords
Power tunnels, Topology optimization, Volume constraints, Finite element an alysis, Factor of safety
With the increasing demand for urban power supply, power tunnels have gradually emerged as the primary channels for urban power trans mission. However, the long construction routes of power tunnels, combined with substantial variations in burial depths and the need to traverse diverse geological stratas, have resulted in highly uneven stress distributions on their structures. In recent years, structural defects in power tunnels have become increasingly evident. Among these defects, structural cracking and subsequent water leakage have become particularly prominent[1–5], posing challenges to the long-term operational safety of these tunnels. These issues underscore the need for further optimization and improvement of the stress performance of power tunnel structures.
To date, researchers at home and worldwide have extensively studied the design and optimization of tunnel structures. Qiangqiang et al.[6,7]proposed a finite element progressive iteration method for optimizing biased
tunnel sections with the objective of minimizing lining eccentricity. Hui et al.[8 ]introduced a joint optimization approach combining the Nelder‒Mead method with parametric design to provide a new idea for optimizing
the cross-sectional morphology and spacing of large-span, s mall-clearance tunnels. Pengfei and Shucai et al.[9,10]used a finite element an alysis software to optimize lining structures under varying load conditions through strength calculations and parameter refinement. Aizhong et al.[11] optimized the shapes of deep tunnel support sections using a hybrid penalty function method to reduce stress concentration at the support edges. Hongpeng et al.[12] employed topology optimization to refine highway tunnel lining structures with weak surrounding rocks under different stress fields. Similarly, Zhenyu et al.[13] developed a synergistic support system based on synergis m principles, proposed a multiobjective synergistic optimization design approach for tunnel support systems, and tested its field applications. Dawei et al.[14]proposed an optimal design approach for tunnel cross-sections under complex conditions based on bending-moment minimization, while Qi et al.[15]modeled the primary structural plane of a tunnel based on the optimized kriging interpolation method and derived its optimal spreading pattern. Further, Dianchun et al.[16]optimized noncircular tunnel linings using the hyperstatic response method, while Qing et al.[17]refined the reliability design of tunnel support systems for rocks with multiple damage modes using response surface methodology. Yutao et al.[18]improved the structural design of underground comprehensive pipe galleries through response surface modeling, achieving notable reductions in the bending moment of the control section and structural costs. Haixiang et al.[19]employed the convergence–confinement method to examine interactions between rock stress and support effects for addressing the three-dimensional relationship between tunnel deformation and support response. Finally, Quanwei et al.[20]introduced the concept of active support to optimize support systems for large-span, shallow, buried hard-rock tunnels. The above brief literature review highlights that to date, researchers have predominantly focused on the structural optimization of highway and railway tunnels as well as comprehensive pipe galleries using methods such as optimization objective techniques, joint optimization approaches, mixed penalty functions, response surface modeling, and topology optimization. Meanwhile, studies on the optimization design of power tunnels remain scarce, despite the increasing prevalence of structural defects. To ensure the safety, economic efficiency, and reliability of power tunnel structures, conducting targeted optimization research is thus essential.
In response to this, the current study applied the variable density method and numerical simulation method to derive topology optimization conditions under varying elastic modul i and burial depths of power tunnels. It examined the topology optimization characteristics of power tunnel structures under these conditions. Considering a straight-wall arched power tunnel as an example, design optimization insights derived from the topology optimization results were used to establish a power tunnel ana lysis model accounting for geological structures. Changes in the structural safety performance of the power tunnel before and after structural section optimization were compared to guide the subsequent refinement of lining structure sections and provide a technical reference for the improved design of similar power tunnel engineering structures.
Basic theory of topology optimization
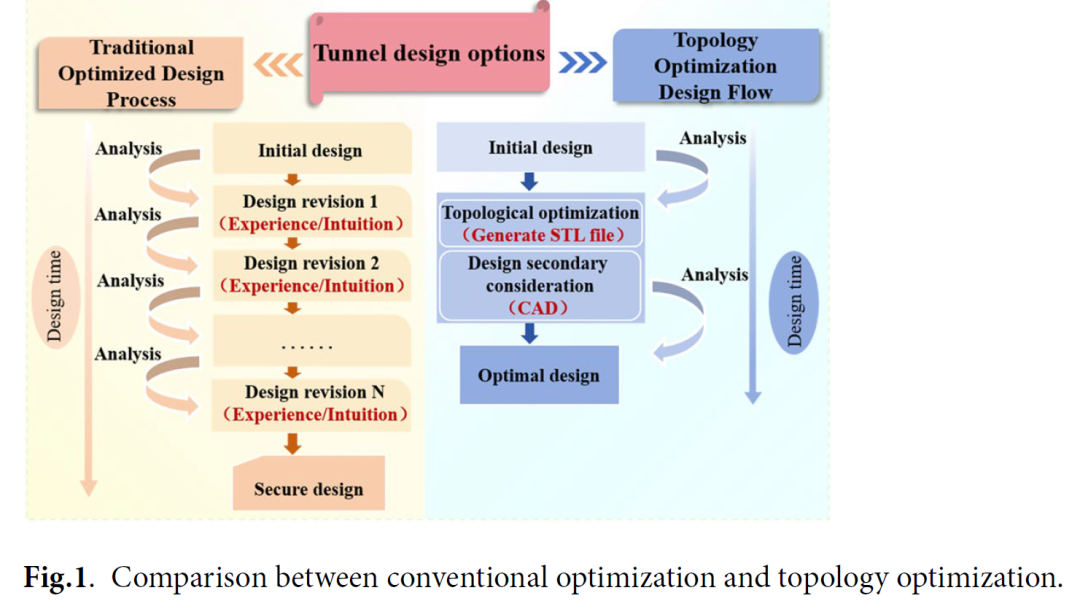
Structural optimization primarily focuses on reducing the weight of structures and reconfiguring their designs to achieve optimal configurations by eliminating redundancies[21]. Topology optimization, a subset of structural optimization, is often more efficient than traditional optimization methods. It identifies the optimal design direction and framework within a shorter timeframe (Fig. 1) and is not constrained by specific geometric forms. The process of topology optimization involves establishing a mathematical model under specific constraints and applying suitable optimization algorithms to iteratively improve structural performance indices until an optimal solution is reached[22].
This study adopted the variable density method for the topology optimization of the power tunnel structure[23]. The objective was to maximize the overall stiffness (minimize flexibility) of the power tunnel structure under given volume constraints. Assuming a variable material density, the relative density ( ) was adopted as the design variable[24], with its value ranging between [0,1]. The mathematical model of topology optimization was formulated as follows[25]:
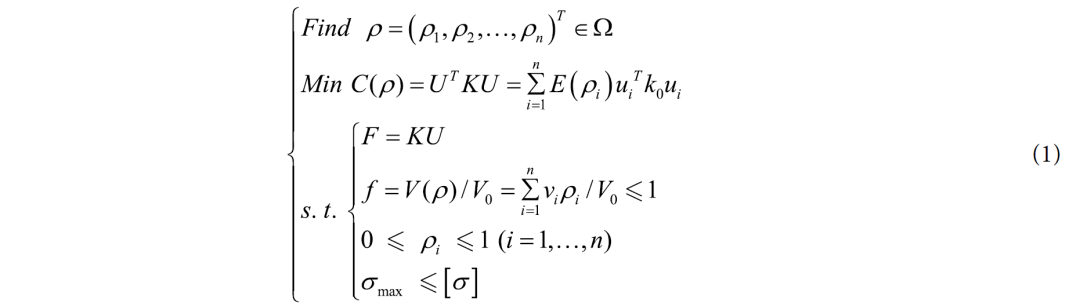
where 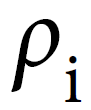 denotes the unit density (kg/m³), C represents the flexibility strain energy of the structure (MJ), U signifies the total displacement of the structure (m), K denotes the total stiffness matrix (N/m), E represents the elastic modulus of the material (MPa), F indicates the external force applied to the structure (N), f represents the volumetric constraint parameter, V denotes the structural volume after optimization (m3),
 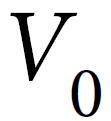 represents the initial structural volume (m³),
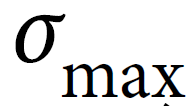 signifies the maximum structural stress (MPa), and [σ] denotes the permissible stress of the structure (MPa).
The relationship between the material density and properties is expressed as[26]:

where 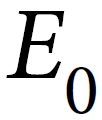 denotes the elastic modulus of the actual material (MPa) and μ represents its Poisson’s ratio.
Topology optimization an alysis of the straight-wall arched power tunnel Volume-constrained topology optimization
During the volume-constrained topology optimization of power tunnel structures, the original tunnel structural contour serves as the reference benchmark. Further, to ensure that the effective internal space of the tunnel remains unchanged, its original cross-sectional area (S1) is expanded outward to derive its extended cross-sectional area (S2) (Fig. 2).
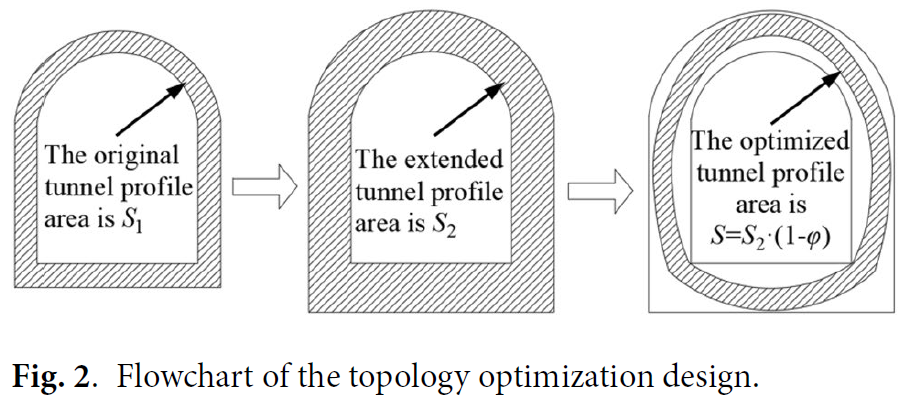
Subsequently, using the tunnel length as the unit length (l), the original tunnel volume is expressed as S1·l, while the expanded tunnel volume is represented as S2·l. These values define the volume constraints for the topology optimization process. This optimization aims to achieve a structural profile with a volume equivalent to that of the original tunnel section. Consequently, the extended volume is reduced during the optimization, resulting in a refined structural contour for the power tunnel. This contour serves as the optimized contour of the power tunnel structure, with the reduction rate (φ) defined as follows:

Finite element modeling for topology optimization
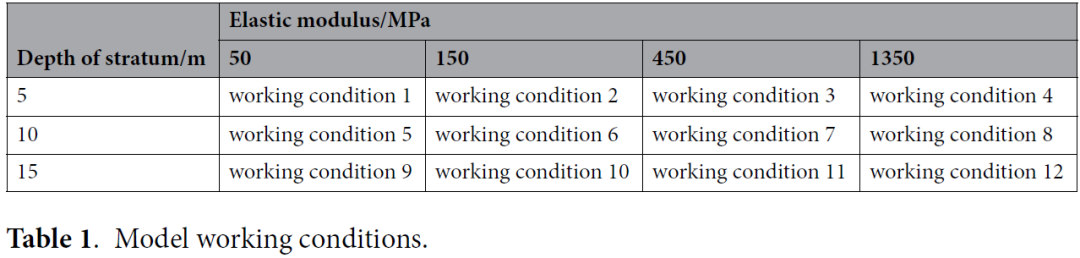
To evaluate the optimization performance of the approach for power tunnels under varying burial depth and geological conditions, two-dimensional finite element modeling was conducted using midas NFX software. Further, assuming that the power tunnels remained in the elastic working stage, the linear static an alysis module was employed. Three burial depth conditions (5, 10, and 15 m) and four geological conditions with elastic modu li of 50, 150, 450, and 1350 MPa were selected, resulting in 12 topology optimization models (Table 1).
The model dimensions were set as follows: a length of 20 m and widths of 10, 15, and 20 m, corresponding to burial depths of 5, 10, and 15 m, respectively (Fig. 3). In each model, the internal net width and height of the power tunnel were set to 2.0 and 2.3 m, respectively. The upper arch height-to-span ratio was 0.25, with an average curvature of 0.733. To accommodate topology optimization effects, the thickness of the tunnel lining was increased from the original design thickness of 0.25 to 0.5 m. Consequently, the structural cross-sectional area was expanded from 2.20 to 4.85 m2, requiring a 55% reduction in the cross-sectional area after topology optimization.
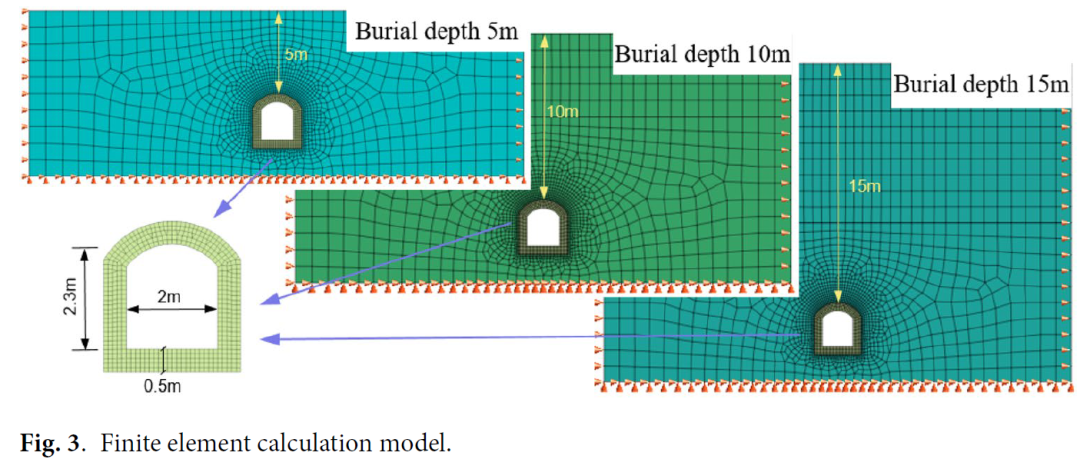
The grid cells of the power tunnel lining structure were coded as “1”, representing units to be optimized, while the surrounding stratum cells were coded as “0”, representing nonoptimization units. The model load primarily accounted for self-weight. Boundary conditions were applied as follows: the top of the model was unconstrained (free boundary), the bottom was constrained along the X and Y directions, and the sides were subjected to normal constraints.
An alysis of the topology optimization results
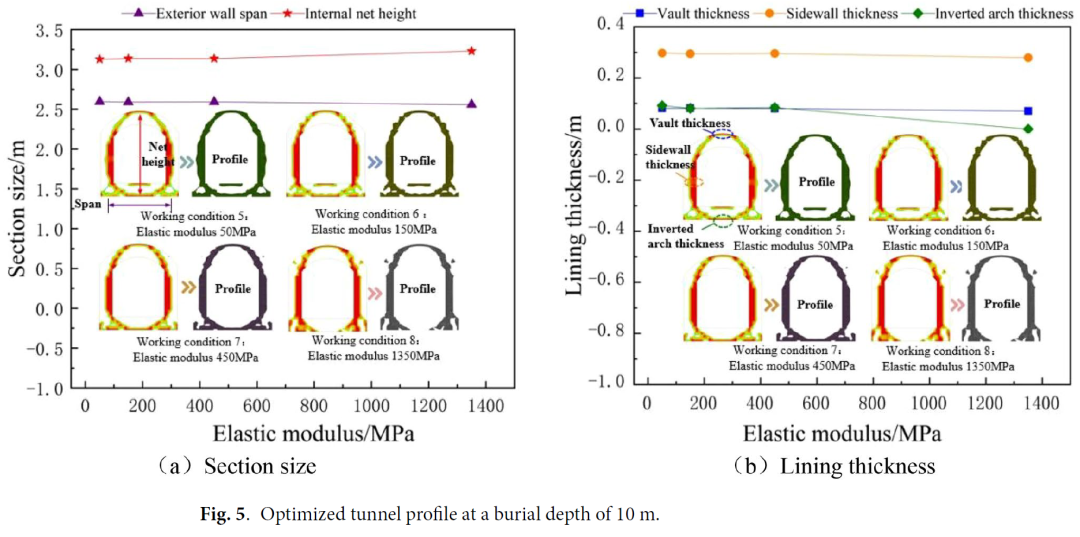
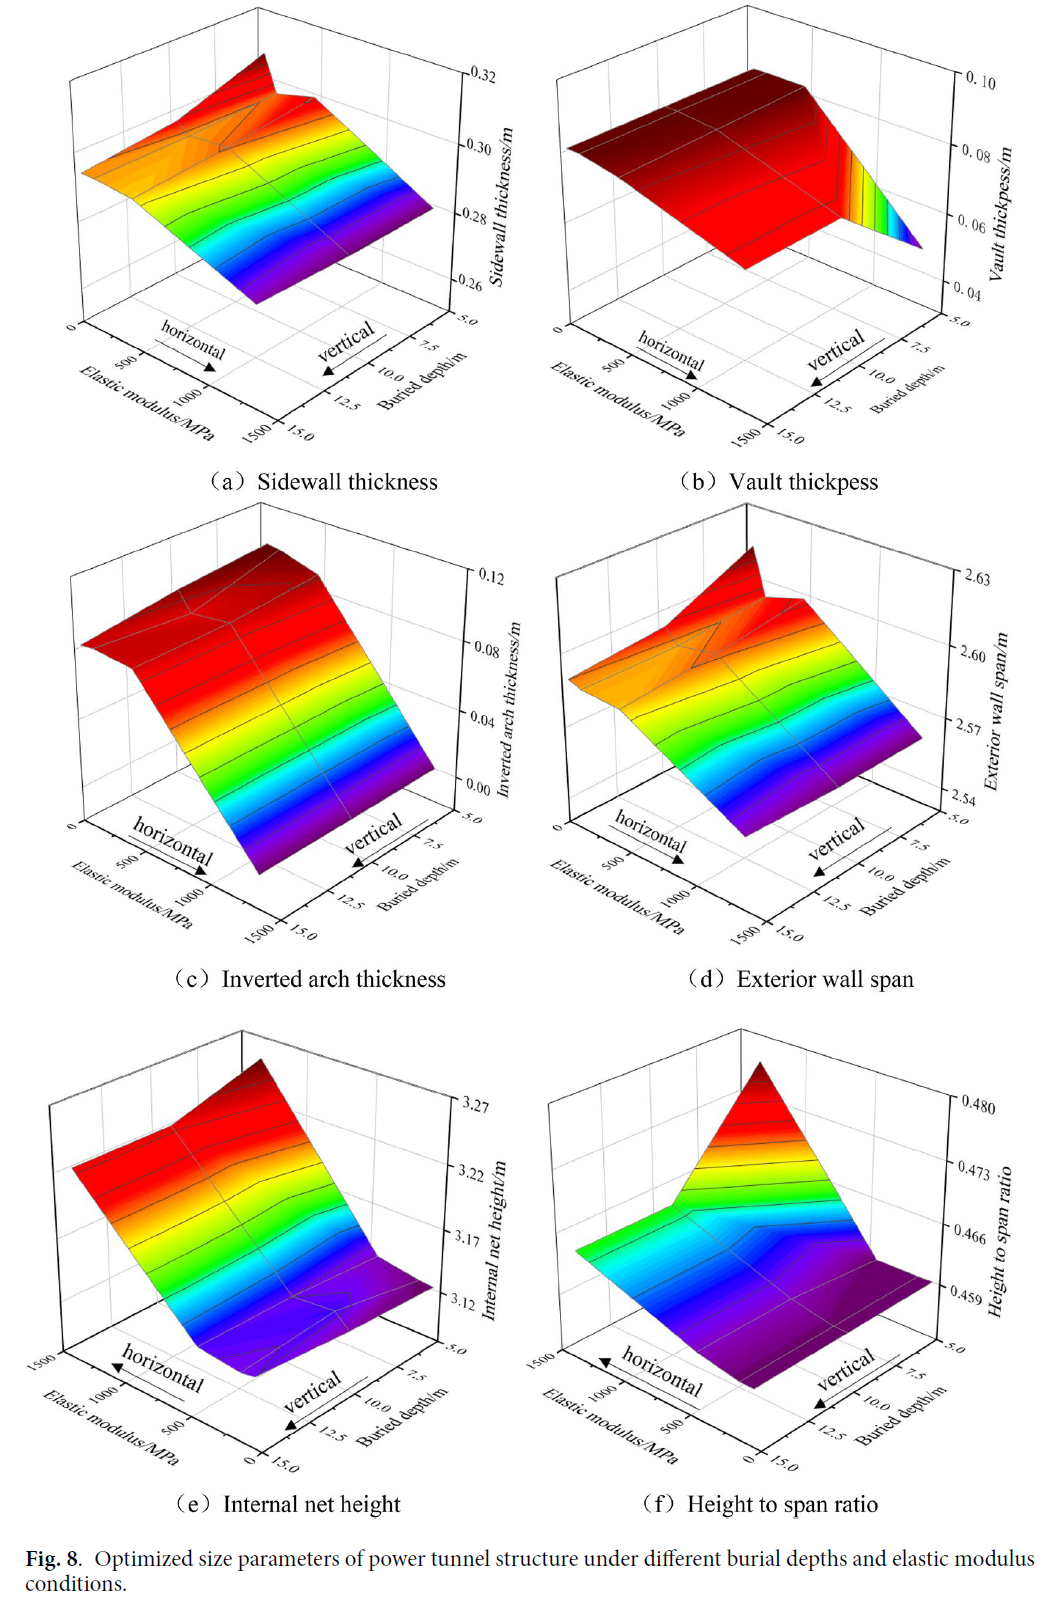
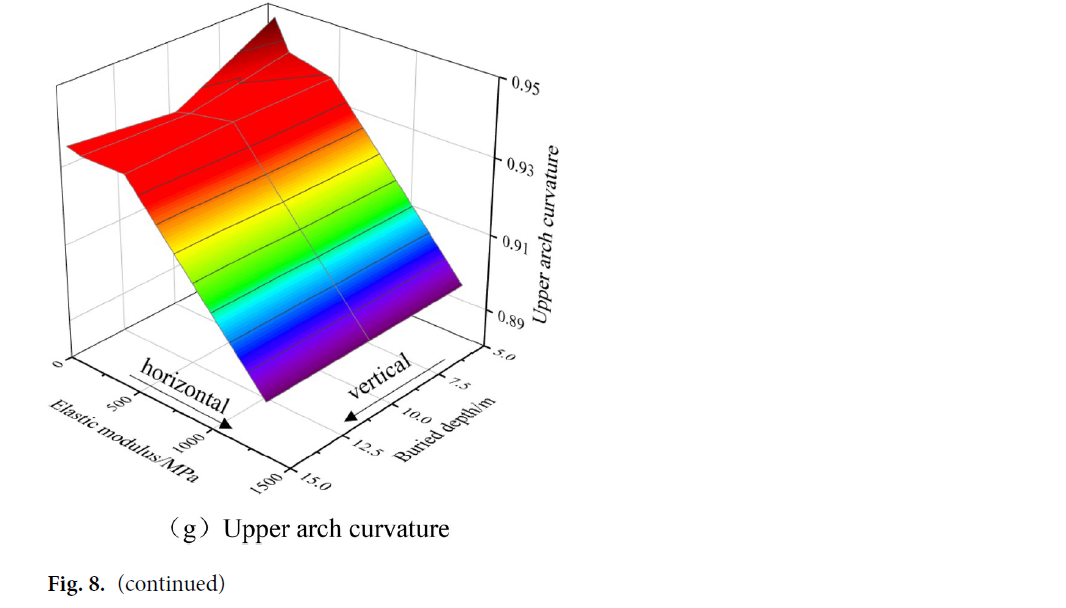
The topology optimization calculations revealed that a relative tunnel lining material density of 0.599 or higher resulted in a 55% reduction in the total volume of the tunnel model, yielding the optimized tunnel lining profile (Figs. 4-7). In the optimized profile, areas of high relative density (indicated in red) were primarily concentrated within the left and right sidewalls while areas of low relative density (indicated in green) were mostly located in the vault and inverted arch (base plate). These findings suggest that compared to the vault and back arch, the sidewalls require additional stiffness reinforcement to enhance the overall structural performance of the power tunnel. Measurements of the dimensions of the optimized structural profile under different burial depths and geological conditions revealed the following:
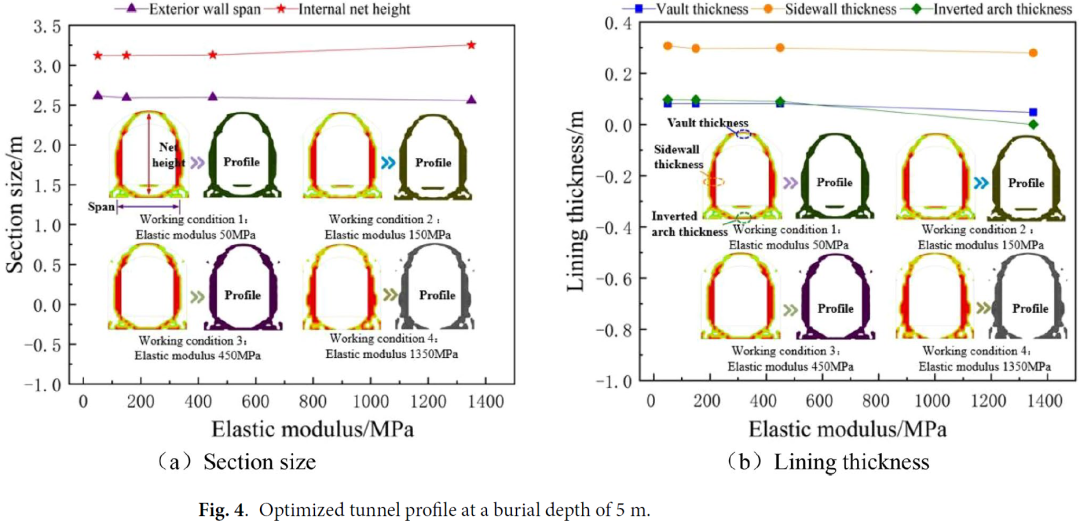
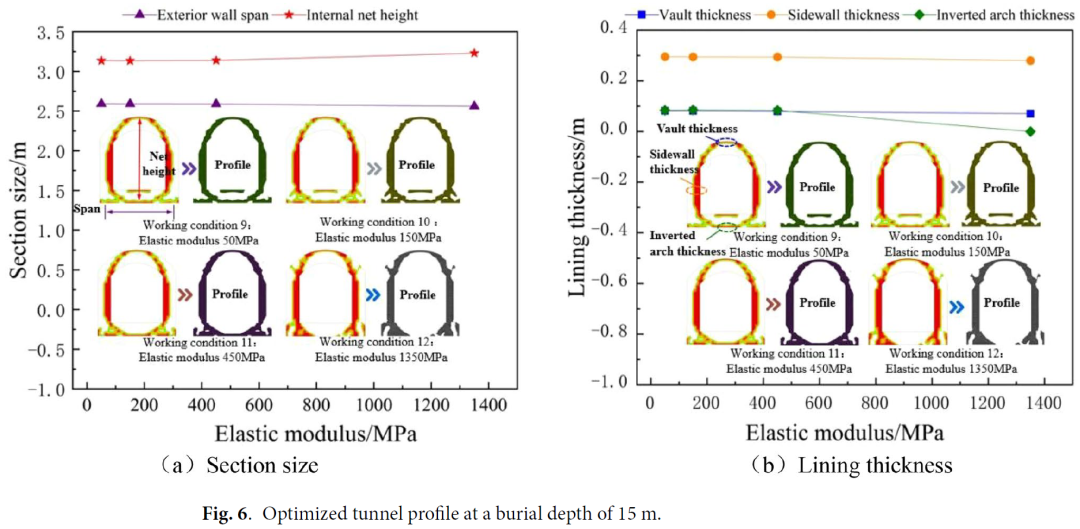
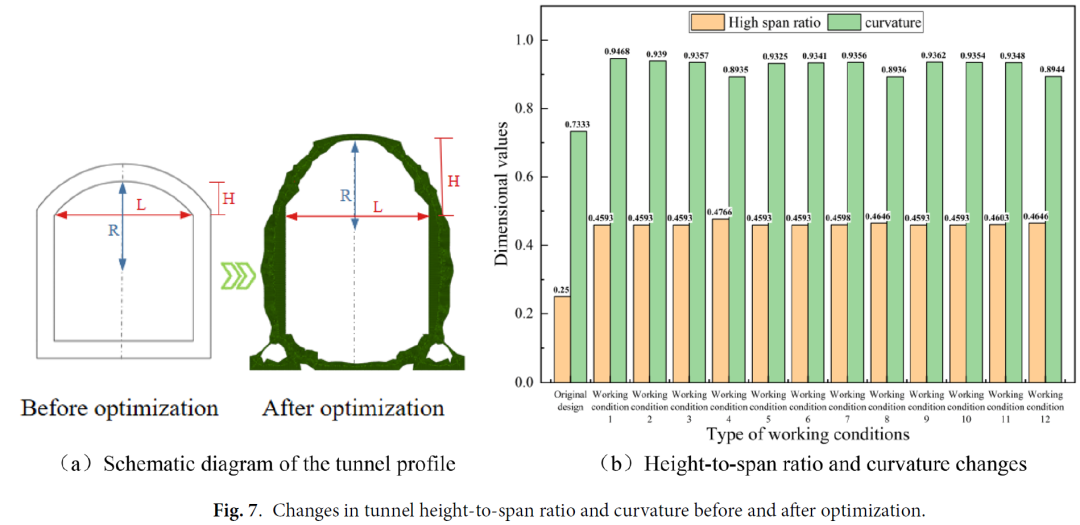
(1)When the burial depth is 5 m, the span of the external wall of the power tunnel increases from 2.50 m for the straight-wall arch tunnel to 2.613, 2.593, 2.598, and 2.558 m for Cases 1, 2, 3, and 4, respectively, representing increases of 4.54%, 3.70%, 3.91%, and 2.33%, respectively. Similarly, the internal net height increases from 2.30 m for the straight-wall arch tunnel to 3.122, 3.123, 3.129, and 3.253 m for Cases 1, 2, 3, and 4, respectively, denoting increases of 35.73%, 35.78%, 36.06%, and 41.44%, respectively. The thickness of the vault decreases from 0.25 m for the straight-wall arch tunnel to 0.082, 0.082, 0.082, and 0.047 m for Cases 1, 2, 3, and 4, respectively, representing reductions of 67.40%, 67.40%, 67.40%, and 81.24%, respectively. The inverted arch thickness decreases from 0.25 m for the straight-wall arch tunnel to 0.097, 0.096, 0.089, and 0 m for Cases 1, 2, 3, and 4, respectively, corresponding to reductions of 61.28%, 61.76%, 64.36%, and 100%, respectively. In contrast, the thickness of the sidewalls increases from 0.25 m for the straight-wall arch tunnel to 0.307, 0.296, 0.299, and 0.279 m for Cases 1, 2, 3, and 4, respectively, reflecting increases of 22.68%, 18.52%, 19.56%, and 11.64%, respectively. The height-to-span ratio increases from 0.25 for the straight-wall arch tunnel to 0.459, 0.459, 0.459, and 0.477 for Cases 1, 2, 3, and 4, respectively, representing increases of 83.70%, 83.70%, 83.70%, and 90.62%, respectively. Finally, the upper arch curvature increases from 0.733 for the straight-wall arch tunnel to 0.947, 0.939, 0.936, and 0.894 for Cases 1, 2, 3, and 4, respectively, reflecting increases of 29.17%, 28.10%, 27.65%, and 21.90%, respectively.
Topology optimization example application
Example project overview
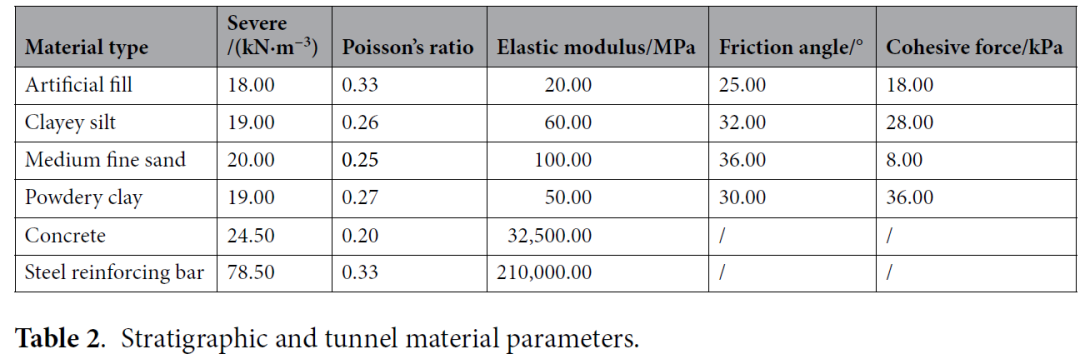
A 110-kV power tunnel was selected with a straight-wall arch configuration, featuring an internal headroom of 2.0 m × 2.3 m. The second lining was 0.25 m thick and made of C40 reinforced concrete. The reinforcement configuration included an outer reinforcement with a diameter of 14 mm and spacing of 100 mm and an inner reinforcement with a diameter of 12 mm and spacing of 100 mm. HRB335 steel bars were used for this reinforcement, with a protective layer thickness of 50 mm. The tunnel was located at a depth of 10.6 m beneath the green belt of a main road in Beijing. The stratigraphy, from top to bottom, consisted of an artificial fill layer (1.6-m thick), a clayey silt layer (4.2-m thick), a medium and fine sand layer (2.4-m thick), and a pulverized clay layer (9.6-m thick). Specific material and stratigraphic parameters are detailed in Table 2.
Structural optimization modeling
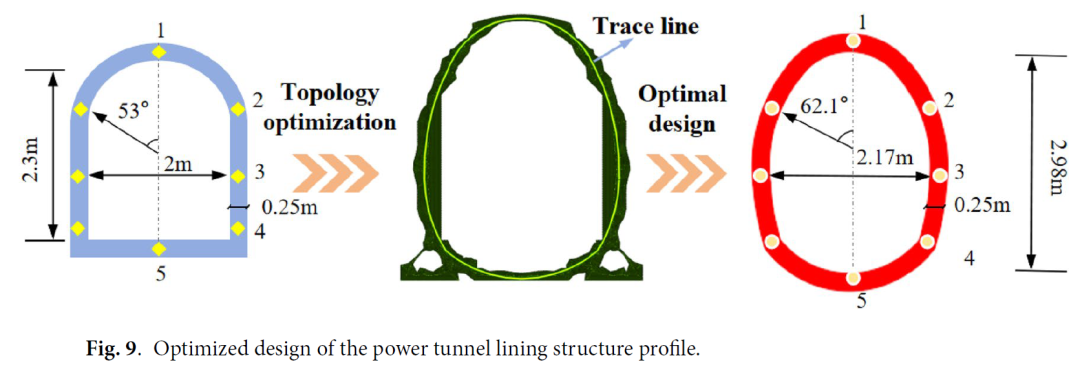
To boost the structural performance of the power tunnel lining, the central trace contour of the tunnel structure was extracted based on the topology optimization results detailed in the previous section. This contour was used to refine the original tunnel profile. Following the optimization design, the cross-section of the power tunnel was adjusted from the original straight-wall arch to a five-centered circle with an inverted arch, as depicted in Fig. 9. The top-down arc radii of the five-centered circle with inverted arch tunnel sections ⌒1′2', ⌒2′3', ⌒3′4', and ⌒4′5'were 0.98, 2.86, 1.77, and 1.02 m, respectively, with angles of 62.1°, 29.2°, 20.3°, and 40.3°, respectively.Based on the dimensions of the tunnel section before and after optimization, two types of two-dimensional finite element models were created in the midas GTS software, incorporating regional stratigraphic characteristics (Fig. 10).
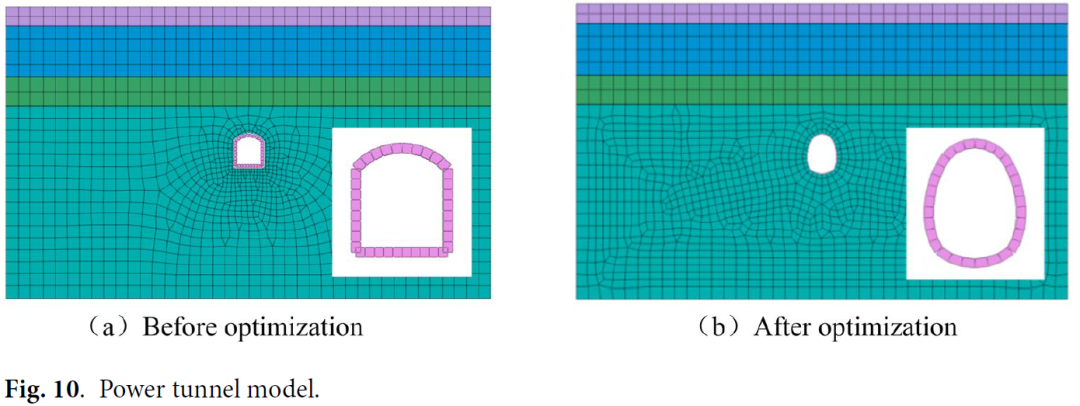
Each model was 40-m long and 24-m high, with a tunnel lining thickness of 0.25 m. The an alysis considered only the influence of self-weight load. Additionally, five measurement points were set at key locations in the tunnel model: the arch top, arch shoulder, wall waist (arch waist), wall foot (arch foot), and base plate (inverted arch). These points were used to compare and an alyze the structural stress performance of the power tunnel lining before and after optimization.
Optimization results an alysis
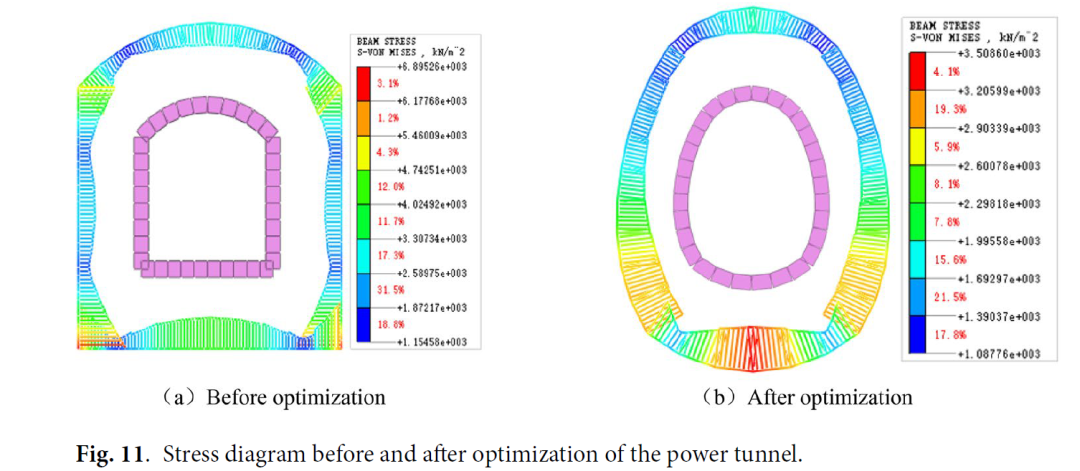
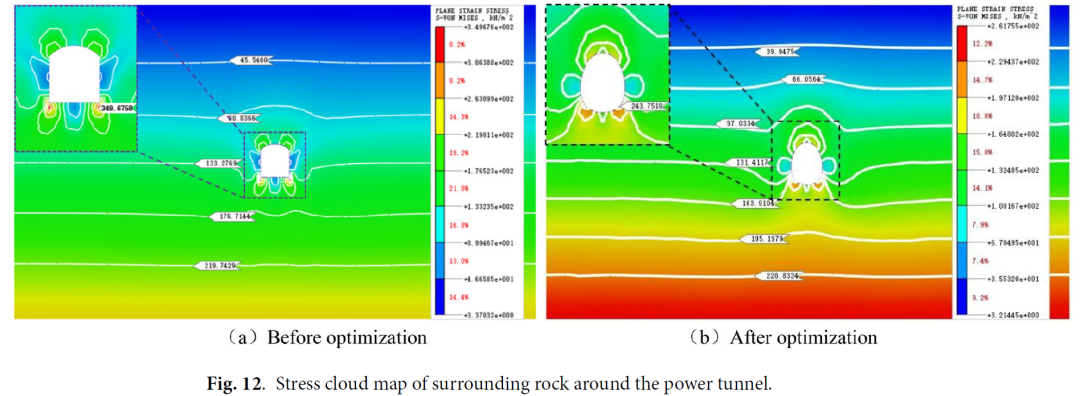
Figures 11 and 12 reveal that the maximum stress within the tunnel structure and surrounding strata before and after optimization occurred near the tunnel wall foot (arch foot). Before optimization, the maximum stress within the power tunnel structure was 6895.26 kPa, while that in the surrounding strata was 349.68 kPa. After optimization, these values decreased to 3508.60 and 243.75 kPa, respectively, representing reductions of 49.07% and 30.29%, respectively. These results indicate that the topology optimization design substantially reduced the maximum stress in both the lining structure and surrounding strata, improving the overall stability and safety of the power tunnel and surrounding strata.
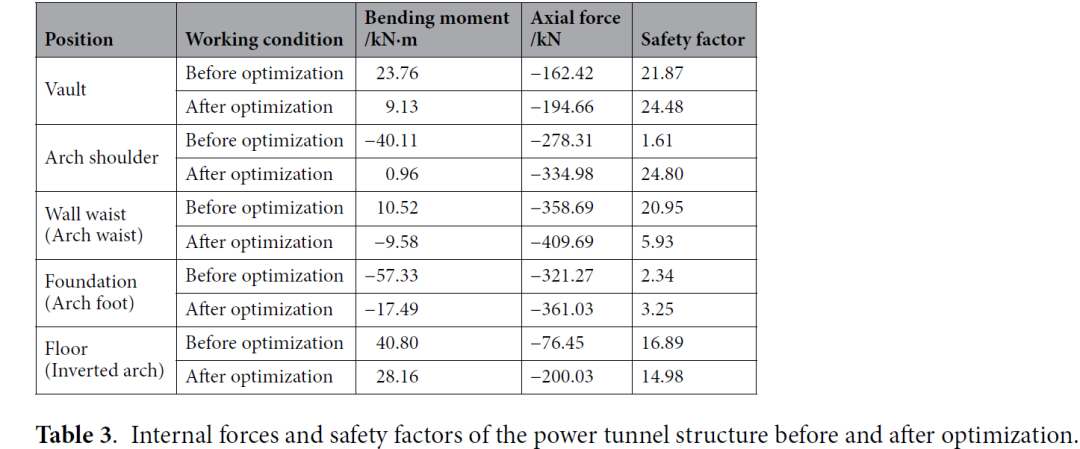
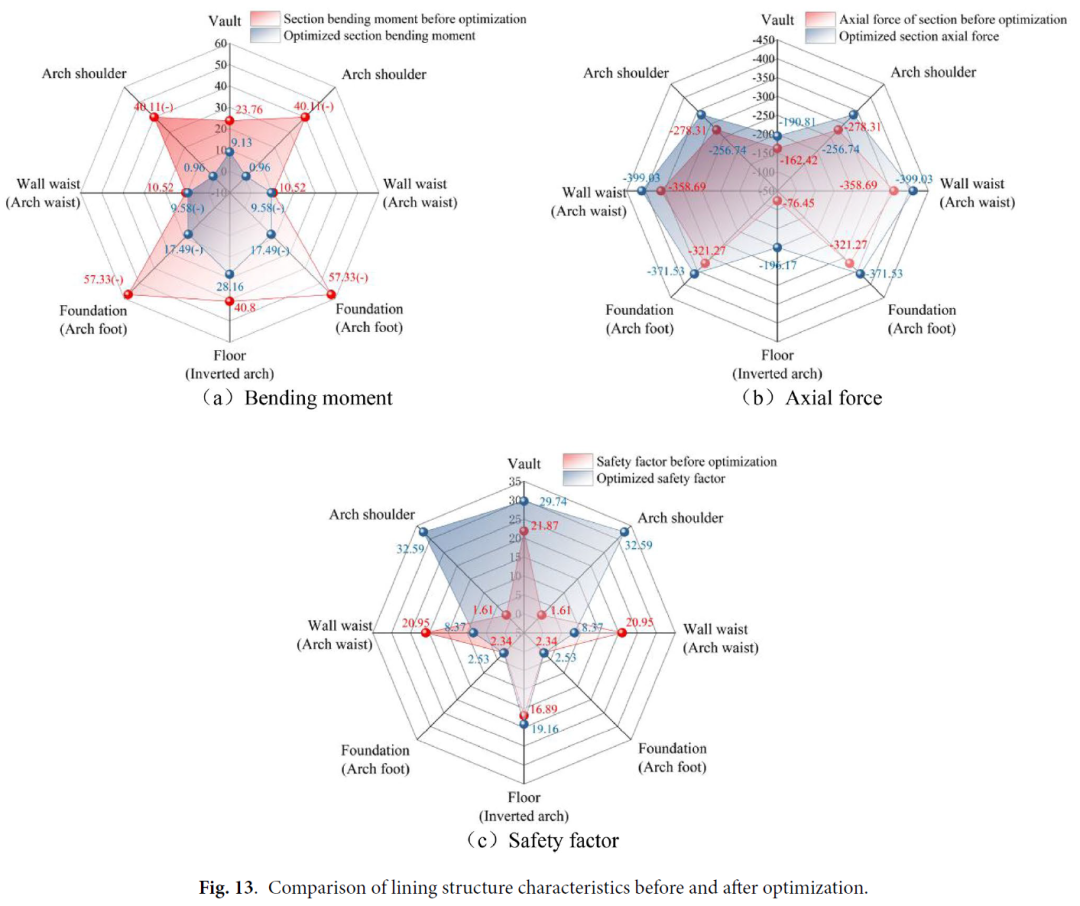
As indicated in Table 3 and Fig. 13, the bending moments at the arch, arch shoulder, wall waist (arch waist), wall foot (arch foot), and base plate (inverted arch) were 23.76, −40.11, 10.52, −57.33, and 40.8 kN·m, respectively, before optimization. After optimization, these values changed to 9.13, 0.96, −9.58, −17.49, and 28.16 kN·m, representing changes of −61.57%, −97.61%, −8.94%,−69.49%, and −30.98%, respectively. Thus, the bending moment reduction was greatest at the arch shoulder, followed by the arch top, wall foot (arch foot), and base plate (inverted arch), with the s mallest reduction occurring at the wall waist (arch girdle). Meanwhile, the axial forces at the vault, arch shoulder, wall waist (arch waist), wall foot (arch foot), and base plate (inverted arch) were −162.42, −278.31, −358.69, −321.27, and −76.45 kN, respectively, before optimization. After optimization, these values were −194.66, −334.98, −409.69, −361.03, and −200.03 kN, respectively, representing changes of 19.85%, 20.36%, 14.22%, 12.38%, and 161.65%, respectively. It can be seen that the axial forces at all parts of the optimized tunnel have increased, with the most significant increase occurring at the bottom plate (inverted arch).
To better reflect the changes in structural safety after optimization, the structural safety coefficient of the power tunnel was calculated before and after optimization according to the relevant requirements of the Road Tunnel Design Code. The calculations proceeded as follows:
(1) For a rectangular pressurized zone, the safety factor considering component bending was calculated using Eq. (4):

(2) For large eccentric compression (x≤0.55h0), the safety factor considering compressed steel bars was calculated using Eq. (5):

(3) For s mall eccentric compression (x>0.55h0), the safety factor considering compressed steel bars was calculated using Eq. (6):

In the above equations, K denotes the safety coefficient; M represents the bending moment (kN·m); N signifies the axial force (kN); e denotes the eccentricity of the axial force (m);  represents the ultimate flexural compressive strength of concrete (MPa); b denotes the cross-sectional width (m); x signifies the height of the concrete compression zone (m);
  denotes the effective height of the cross-section (m);
  represents the standardized tensile or compressive strength of the steel bar (MPa);
  and
and represent the cross-sectional areas of the reinforcement in the tension and compression zones (m²), respectively; and a and a′ denote the distances from the centers of gravity of and to the nearest cross-sectional edge (m), respectively.
Table 3 and Fig. 13 reveal that the safety coefficients of the tunnel vault, arch shoulder, wall waist (arch waist), wall foot (arch foot), and base plate (inverted arch) before optimization were 21.87, 1.61, 20.95, 2.34, and 16.89, respectively. After optimization, these coefficients were 24.48, 24.80, 5.93, 3.25, and 14.98, respectively, representing changes of 11.93%, 1440.37%, −71.69%, 38.89%, and −11.31%, respectively. Before optimization, the safety coefficients of the arch shoulder and wall foot were less than 2.4, failing to meet the specifications requirements. However, after optimization, these coefficients exceeded 2.4, meeting the requirements. Among them, except for the safety factors at the tunnel wall waist (arch waist) and the bottom plate (inverted arch) which have been reduced, the safety factors of other parts have been improved. This indicates that following optimization, the bending moments and axial forces acting on the power tunnel structure were effectively redistributed, enhancing the overall safety and stress performance of the structure. Notably, the wall foot (arch foot) consistently exhibited the s mallest safety coefficient before and after optimization, which coincides with the additional external legs identified during topology optimization. Hence, we recommend that future designs should focus on optimizing the reinforcement design of the wall foot.
Conclusion
1) Under the same burial depth conditions, with the increase of the elastic modulus of the stratum (improvement of surrounding rock conditions), the internal net height and height-to-span ratio of the optimized power tunnel generally show an increasing trend, while the external wall span, vault thickness, invert thickness, sidewall thickness, and camber curvature generally show a decreasing trend. On the other hand, under the same elastic modulus of the stratum, with the increase of burial depth, the various dimension indicators in the lining structure contour of the topologically optimized power tunnel generally do not change significantly. Overall, the influence of stratum conditions on the contour size of the optimized power tunnel structure is more significant than that of burial depth. Therefore, during the design of power tunnel structures, more emphasis should be placed on the a nalysis and control of stratum conditions.
2) From the perspective of the morphological characteristics of the power tunnel profile, the optimized power tunnel profile shows a trend of transformation from a straight-wall arch shape to a multi-centered circular shape. Moreover, there is a support structure on the outer side of the power tunnel wall foot, so it is recommended to appropriately reinforce the wall foot of the power tunnel during the design. In addition, when the elastic modulus of the stratum reaches 1350 MPa, the structure of the power tunnel invert arch disappears, indicating that the self-stability of the power tunnel stratum is good under this condition, and theoretically, the invert arch structure can be omitted.
3) Using topology optimization design principles, a straight-wall arched power tunnel was optimized into a five-centered circle with an inverted arch. Modeling and calculation results revealed that the bending moments and axial forces were effectively redistributed across the optimized structure, leading to improved safety factors of over 2.4 for all structural components, meeting design specifications and notably improving the overall stress performance of the power tunnel.
References
1. Taoyong, F. et al. Crack mechanis m of machine-made sand concrete tunnel lining. J. Railw. Sci. Eng. 20(11), 4288–4298 (2023).
2. Yuan Bingxiang, Liang Jingkang, Huang Xianlun, et al. Eco-efficient recycling of engineering muck for manufacturing low-carbon geopolymers assessed through LCA: Exploring the impact of synthesis conditions on performance. Acta Geotech. (2024).
3. Jianzhang, G. et al. An alysis on structural disease characteristics and laws of lining in long-serving pipeline tunnel. J. Safety Sci. Technol. 20(07), 78–86 (2024).
4. Yuan, B. et al. Experimental study on influencing factors associated with a new tunnel waterproofing for improved impermeability. J. Test. Eval. 52(1), 344–363 (2024).
5. Yuan, B. et al. Sustainability of the polymer SH reinforced recycled granite residual soil: properties, physicochemical mechanis m, and applications. J. Soil. Sedim. 23(1), 246–262 (2023).
6. Qiangqiang, B. & Jian, C. Study on the optimal shape of biased-pressure tunnel based on rational arch axis. Chin. J. Rock Mech. Eng. 42(S1), 3160–3168 (2023).
7. Qiangqiang, B. & Chen, J. An iterative FEM approach for tunnel shape optimization based on the concept of rational arch axis. Structure 34, 4634–4651 (2021).
8. H Wang W Chen C Pi et al. Study of section morphology and reasonable distance optimization of large-span twin tunnels with s mall clear spacing in shallow rock mass. Rock Soil Mech.32S2, 641–646 (2011).
9. Pengfei, Li. et al. mechanical properties of lining structure and lts cross section shape optimization of subsea tunnel. China Railw. Sci. 30(03), 51–56 (2009).
10. Li Shucai, Xu. & Bangshu, L. S. Lining structure type of subsea tunnel aad its support parmeters optimizing. Chin. J. Rock Mech. Eng. 21, 96–104 (2005).
11. Aizhong, Lv. et al. Shape optimisation of the support section of a tunnel at great depths. Comput. Geotech. 61, 190–197 (2014).
12. Hongpeng, L. et al. Topological optimization for highway tunnel lining structure pattern of soft-wreak surrounding rocks. Highway 4, 203–207 (2011).
13. Zhenyu, S. et al. Synergistic optimization design method for tunnel support structure system and its application. Chin. J. Geotech. Eng. 43(03), 530–539 (2021).
14. Dawei, H. et al. A nalysis for optimal design of cross section of metro shield tunnel based on minimum bending moment. J. China Railw. Soc. 40(9), 159–166 (2018).
Scientific
15. Qi, Z. et al. Modeling of main discontinuities of rock tunnel based on optimized Kriging interpolation method. Chin. Civil Eng. J. 55(S2), 74–82 (2022).
16. Dianchun Du, Daniel Dias, Ngocanh Do. Lining performance optimization of sub-rectangular tunnels using the Hyperstatic Reaction Method. Comput. Geotech. 117 (2020).
17. Qing, Lv. et al. Reliability based design optimization for a rock tunnel support system with multiple failure modes using response surface method. Tunn. Undergr. Space Technol. 70, 1–10 (2017).
18. F Yutao Li Weibin. A study on structural optimization of utility tunnel based on response surface model method. J. Yunnan Univ. (Nat. Sci. Edit.) 44(04), 791-799 (2022).
19. Liuming Chang, Leandro R. Alejano, et al. Limitation of convergence-confinement method on three-dimensional tunnelling effect. Sci. Rep. 31, 1 (2022).
20. Quanwei Liu, Yongshun Li, Weiteng Li, et al. Primary support optimization of large-span and shallow buried hard rock tunnels based on the active support concept. Sci. Rep. 12, 1 (2022).
21. Sun Jialiang, Tian Qiang, Hu Haiyan.Advances In Dynamic Modeling Aad Optimization Of Flexible Multibody Systems. Chin. J. Theor. Appl. Mech. 51(06), 1565–1586 (2019).
22. Mao, D. et al. Topology optimization strategy of structural strength based on variable density method. J. Shanghai Jiao Tong Univ. 55(06), 764–773 (2021).
23. Yu Wang Yu Li Shuaishuai Ying. 2020 Structure design and process planning aor additive manufacturing. J. Tongji Univ. (Nat. Sci.) 48(06), 869-879
24. Chen Yongping,Gao Liang,Xiao Mi. 2018 Topology optimization design of heat dissipation structures based on variable density method. Comput. Integr. Manuf. Syst. 24(01), 117-126 (2018).
25. Zhang Guofeng, Xu. & Lei, W. X. Research on post-processing method of continuum structure topology optimization based on variable density method. J. Mech. Strength 44(04), 845–851 (2022).
26. Zhen, L. et al. Topological optimization design of continuum structures. Adv. Mech. 04, 463–476 (2004).
Author
From

https://doi.org/10.1038/s41598-025-11158-9