NFX|铁路隧道冻结气温分布预测-隧道长度与外界气温的影响

moAbstract
Railway tunnels have been constructed mainly in cold regions in South Korea recently, and damage related to freezing problems have occurred thereafter. When freezing air temperatures persist inside a tunnel, it causes damage, such as ice formation from leaks and obstruction of drainage flow. The air temperature distribution inside a tunnel is related to the area inside a tunnel, such as tunnel length, cross-section, and so forth. It can be interpreted with a convection mechanis m. Tunnel length is designed depending on site conditions, and it is complicated to predict freezing air temperature distribution in a tunnel. In this study, the air temperature variation inside a long tunnel was measured in winter, and a heat transfer a nalysis model was implemented. A double-track railway tunnel model with a half-length ranging from 500 to 5000m was simulated, and the conditions of freezing temperature distribution inside tunnels were investigated. The research results propose freezing conditions in railway tunnels according to tunnel lengths and minimum outside air temperatures.
Keywords
rail, defect, infrastructure, inspection, railway
New high-speed rail lines were planned in mountainous areas, and then freezing problems inside tunnels were increased in South Korea. The cold weather influences the air temperature change inside a tunnel and determines the freezing effect distance at a minimum air temperature.Freezing damage inside a tunnel occurs within the freezing effect distance and worsens with longer durations.In particular, if the freezing air temperature is distributed in the entire tunnel, the total tunnel length is required to be constructed with an anti-freezing design.The air temperature change inside the tunnel in winter is related to the heat transfer mechanis m, and many studies have been reported to research freezing conditions.
According to the Norwegian Road Tunnels standard,it is stated that the temperature difference, the inlet wind speed at the entrance, and the piston of traffic affect the main influencing factors for freezing (1). Zhou et al. (2)observed that the natural wind and train-induced winds change the air temperature inside the tunnel. Zhao et al.(3, 4) measured the inside air temperature for a long tunnel with a tunnel length of 2910m. The air temperature inside the tunnel was different depending on the tunnel height, such as at the vault, waist, and side wall, and it was also confirmed that the natural wind and traffic wind speeds affected the temperature distribution inside the tunnel. Convective heat transfer mechanis ms can be applied to establish the air temperature distribution inside the tunnel in numerical modeling.
He et al. (5) implemented a convection–conduction coupling model to an alyze the relationship between the airflow in the tunnel and the temperature field in the surrounding.The airflow was assumed to be laminar, and the monthly average temperature change of the tunnel surface was derived through the governing equation.Tan et al. (6) set the solid–air boundary condition in a long tunnel to turbulent flow and investigated the freezing depth according to the increase in wind speed at the tunnel entrance. Xuefe et al. (7, 8) performed numerical simulations using the Galerkin method, which is a finite element method for solving nonlinearly boundary conditions.The air inside the tunnel and ground temperature were predicted for a tunnel (length=1000–1338 m) located in cold regions in China. The studies with tunnel heat transfer an alysis were performed in a single-track tunnel with lengths of about 1–2 km.
The air temperatures inside the tunnel are influenced by convection heat transfer factors, such as the temperature difference and the tunnel length. However, previous studies have interpreted a single-track tunnel model with a limited tunnel length. In South Korea, double tracks are mainly used, so it is difficult to interpret freezing conditions according to various tunnel length conditions. A simple an alytical model using the heat transfer of a tube can be implemented to predict the inside air temperature and freezing conditions under the various tunnel lengths and weather conditions.
In this study, air temperatures were measured inside a long railway tunnel situated in a cold region to predict the distribution of freezing air temperatures during winter.The total lengths of a double-track railway tunnel were modeled up to 10 km, and the inside air temperature variation was investigated based on the outside weather.
Principles of Heat Transfer and Assumptions
Principles of Heat Transfer
The geothermal heat is transferred to the air filling inside the tunnel. However, as cold outside air flows in a tunnel inside, the air temperature distribution inside a tunnel is changed by these temperature differences. The phenomenon is similar to the convective heat transfer of a tube,and the thermal conditions at the tube surface can typically be classified as a constant surface temperature or a constant surface heat flux (9). When the tube surface maintains a constant temperature, the fluid inside the tube exhibits a nonlinearly rising graph in the flow direction.However, when the heat flux is constant, it is represented by a linearly increasing graph. On reviewing the cases of the air temperature measurement inside railway tunnels, it was observed that the air temperature inside the tunnel tends to increase nonlinearly in the flow direction. Therefore, the change in air temperature inside a tunnel can be modeled using the principle of heat transfer when the tube surface temperature (Ts) is constant.
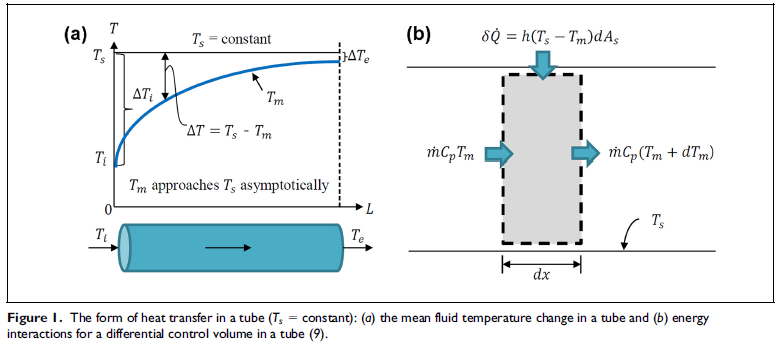
According to the principle of convective heat transfer,the mean inside fluid temperature (Tm) approaches the tube surface temperature nonlinearly, as shown in Figure 1a.
The inside air temperature change depends on the heat transfer rate from the outside air flowing in the tube and can be expressed as in Equation 1. The heat transfer rate inside the tunnel is affected by the heat transfer area (As), which is the size of the flow field, and the average temperature difference (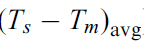 ) between the inside air and the tunnel surface:

Here,  is the rate of heat transfer; As is the heat transfer surface area; h is the average convective heat transfer coefficient;
  is the average temperature difference between the fluid and the surface;
  is the tube surface temperature; and
  is the mean fluid temperature in a tube.
If heating the fluid in a tube, the mean fluid temperature(Tm) increases along the flow direction because of heat transfer. The energy balance on a differential control volume is shown in Figure 1b. The increase in the energy of the fluid is equal to the heat transfer from the tube surface to the fluid by convection (Equation 2):

Here,  is the mass flow rate and Cp is the specific heat capacity.
The differential surface area is 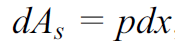 , where p is the perimeter of the tube and
  .
.
Equation 2 can be rearranged as follows:

Integrating from x=0 (outside of the tube Tm=To)to x=L (inner end of the tube where Tm=Ti) gives the following:

This relationship can determine the mean inside fluid temperature at any x by substituting As=pL with px. Equation 4 shows that the temperature difference between the inside air and the tube surface temperature decreases exponentially in the flow direction, and the damping ratio depends on the magnitude of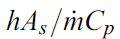 as shown in Figure 1b. This dimensionless parameter is the number of transfer units (NTU), expressed as, and measures the heat transfer efficiency. For NTU>5, the air temperature at the inside end of the tube appears close to the tube surface temperature Ti ≈Ts. If the ratio of increase in the air temperature inside the tube to the outside air temperature is predicted,the initial tube surface temperature can be determined through the NTU.
Application of Heat Transfer Principle Inside the Tunnel
When the convective heat transfer principle of the tube is applied to the tunnel, the initial surface temperature remains constant, and heat transfer occurs between the outside air temperature and the tube surface. When the weather conditions, such as outside air temperature (To)and wind speed, are the same at both entrances, the mean air temperature (Tm) distribution is symmetrical from the left- and right-hand tunnel entrances to the midpoint, as shown in Figure 2.
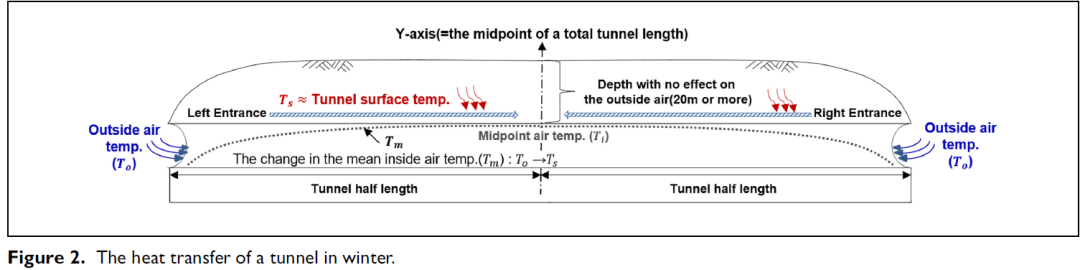
Therefore, the area where outside air can flow into the tunnel was considered as a flow field for an alyzing convective heat transfer in tunnels. The air temperature at the inner end of the tube,shown in Figure 1a, is considered the midpoint of the tunnel (Ti).
If field measurement data are used to an alyze the temperature increase ratio according to tunnel lengths,the tunnel surface temperature (Ts) can also be obtained using the NTU, as shown in Equation 4. It is possible to implement a heat transfer an alysis model that includes freezing-related factors, such as the various flow fields and outside weather conditions, by applying the heat transfer principle of a tube. A double-track railway tunnel was modeled, and the freezing air distribution conditions in the entire railway tunnel were investigated according to the tunnel length and outside air temperatures.
Air Temperature Measurement in the Railway Tunnel
The change in air temperature inside a railway tunnel located in a cold region was measured in February 2019.The double-track tunnel is designed with a width of 11m,a height of 7.8 m, and a length of 8293m (Figure 3a). As cold air has a higher density than warm air, it descends to the tunnel bottom, so the thermometer boxes were installed at the lower position of the tunnel, as shown in Figure 3b.
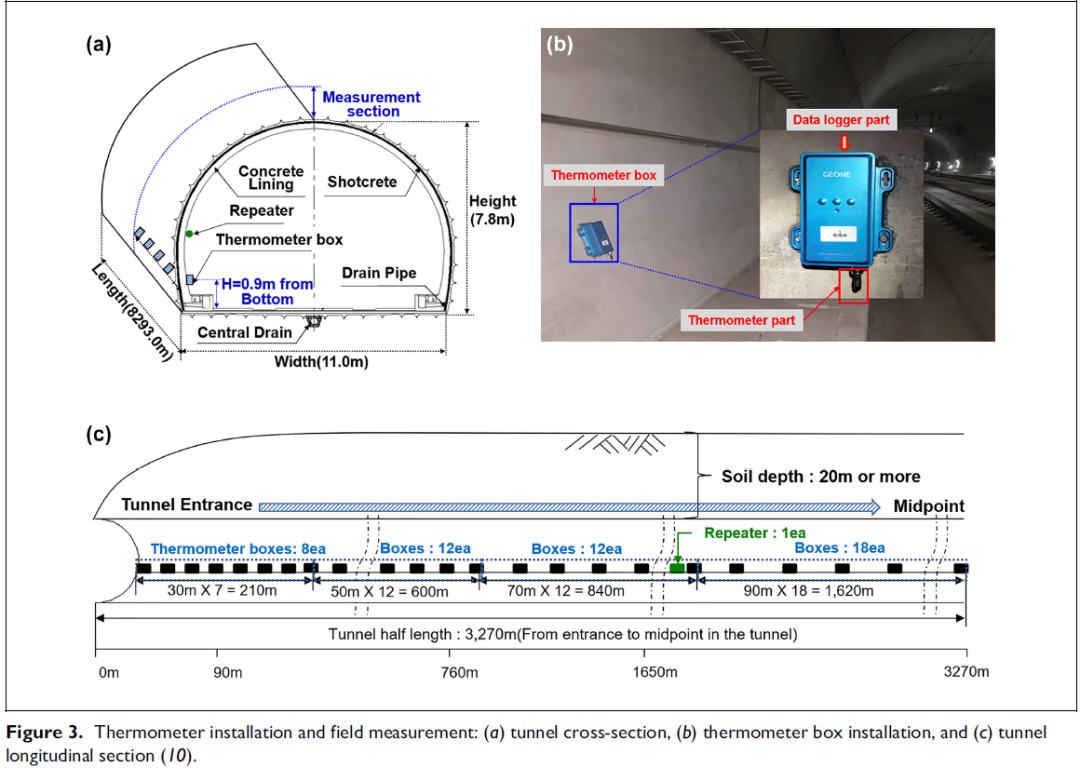
Fifty thermometer boxes and one repeater were installed along the tunnel length from the tunnel entrance (0 m) to the 3270 m, as shown in Figure 3c. The thermometer boxes contain a temperature sensor, a data logger, and a wireless data trans mission system. The inlet wind speed at the tunnel entrance was an average of 1m/s during the measurement period. The ventilation system was not operating during the measuring period because cause it was only used for emergencies.
Air Temperature Change in the Tunnel by Outside Air Temperature
The minimum outside air temperatures were recorded between approximately 0℃and 212.0℃ for 28 days and changed with the daily temperature difference, as shown in Figure 4.
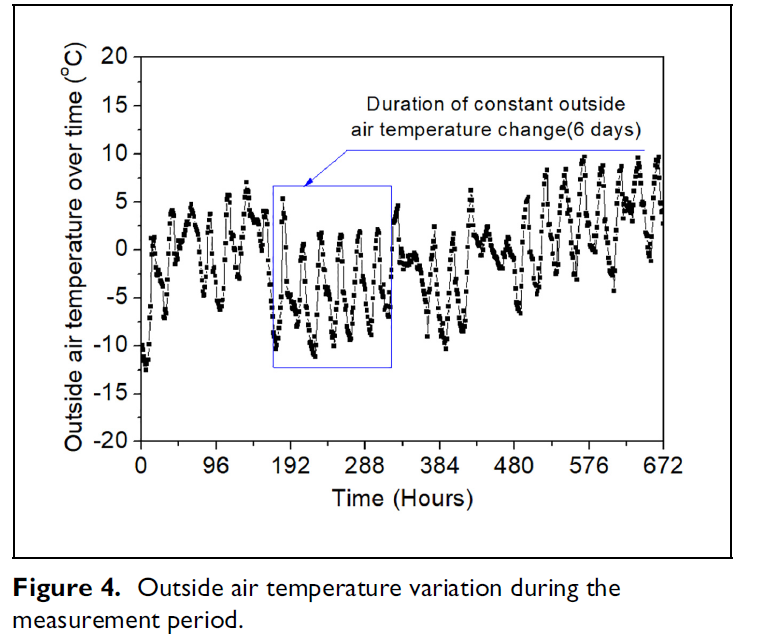
The change in outside air temperature is irregular. Therefore, the measurement data should be selected from periods when the cycle of outside air temperature change was constant. It was found that the minimum air temperatures dropped below 28.0℃ for 6 days after 168 h, and the daily temperature difference was similar during that period.
As a result of the inside air temperature variation for 6 days, it was observed that the inside air tunnel temperatures gradually increased nonlinearly from the entrance to the midpoint of the tunnel (Figure 5).
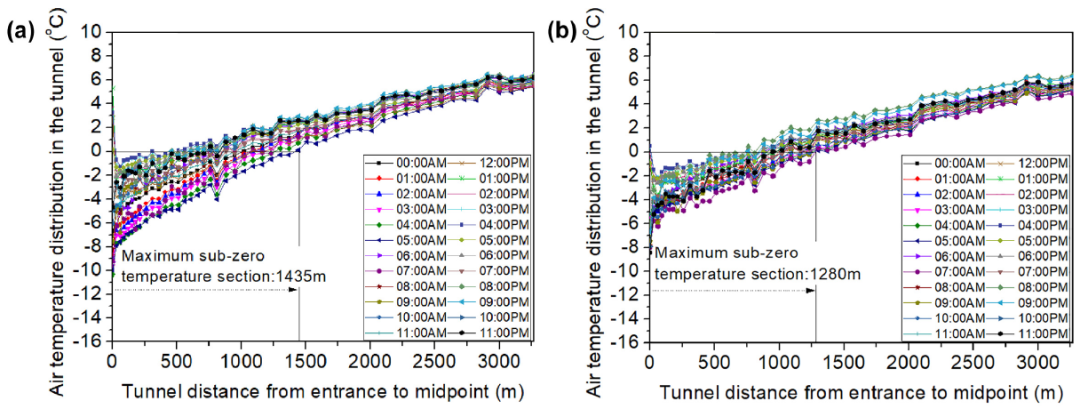
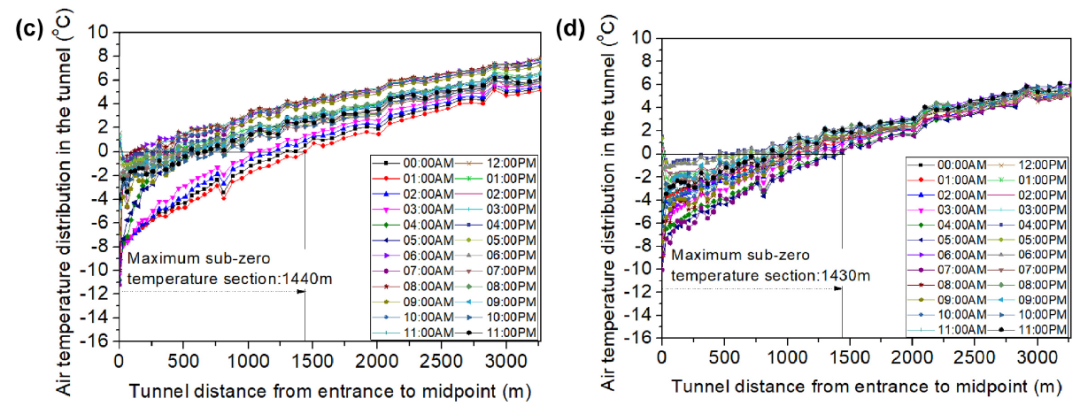
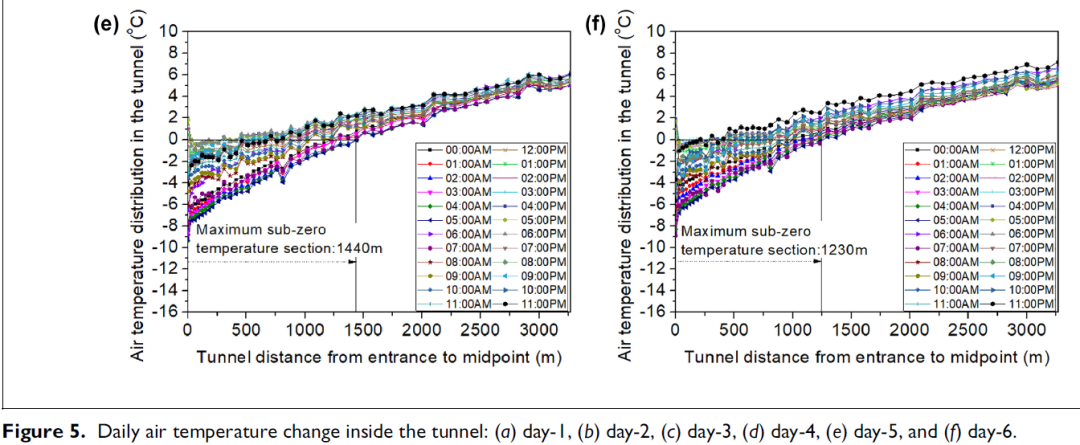
This is similar to the variation of the mean fluid temperature (Tm) under the constant tube surface temperature (Ts) according to the principle of convective heat transfer. The freezing air temperature distribution inside the tunnel related to outside air temperatures during 6 days is shown in Table 1.

The distances of freezing air temperature tend to increase as the air temperature decreases at the tunnel entrance.The inside air temperatures were changed according to the outside air temperatures, and it was observed that the daily temperature difference gradually decreased as the distance increased from the tunnel entrance to the midpoint of the tunnel.
Correlation between Tunnel Length and Outside Air
Temperature Change
The correlation between outside and inside air temperature changes was an alyzed to predict the inside air temperature based on the measurement data over 6 days(Figure 6a). The minimum outside air temperatures(To, min) during 6 days were measured just before sunrise.The maximums (To, max) were measured in the afternoon.The daily outside air temperature difference affected the air temperature inside the tunnel. The difference between the maximum and minimum inside air temperature(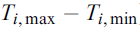 ) decreased as it approached the tunnel midpoint, as shown in Figure 6b.
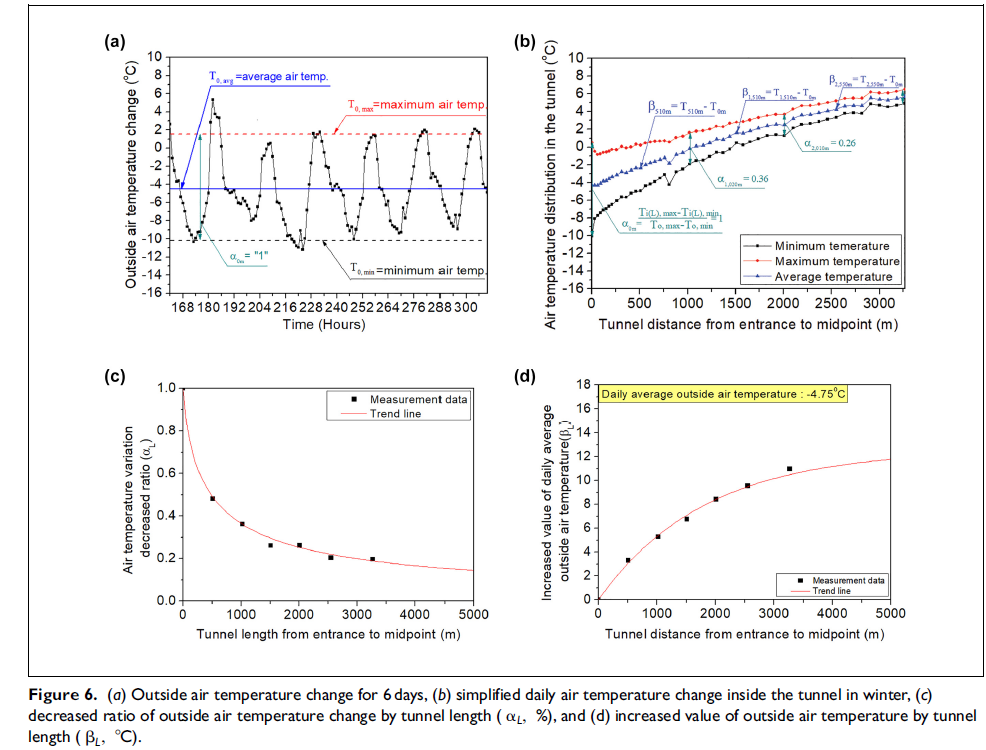
Therefore, the change at each tunnel length is expressed by parameters αL and βL considering the correlation between the inside air temperature and the tunnel length. Here, αL is defined as the ratio of the inside air temperature difference at any length to the outside air temperature difference, while βL is defined as the average temperature difference between the air temperature at any length and at the outside (Equations 5 and 6):

Here,
 is the maximum inside air temperature by tunnel length;
 is the minimum inside air temperature by tunnel length;
 is the maximum outside air temperature;
 is the minimum outside air temperature:

Here,
 is the average inside air temperature by tunnel length
 is the average outside air temperature.
The decreased ratio of the inside air temperature difference can be presented by assuming the outside air temperature difference to be ‘‘1.’’ The average ratio of the inside air temperature difference (αL) decreased to 0.48 at a length of 510m and decreased to 0.36 at a length of 1020m from the entrance. The aL value decreased to 0.2 at a length of 3270m, as shown in Figure 6c. When the average outside air temperature was 24.75℃, the air temperature inside the tunnel increased by approximately 3.3℃ at a length of 510m from the entrance after reviewing the difference between the average inside air temperature by length and the average outside air temperature (βL). The air temperature inside the tunnel increased by approximately 5.2℃ at a length of 1020m from the entrance, by approximately 8.4℃ at a length of 2010m,and by approximately 10.9℃ at a length of 3270m,showing a tendency to increase nonlinearly, as shown in Figure 6d.
When the average outside air temperature changed,the air temperatures inside the tunnel also changed as much as the ratio of aL by the tunnel length. For example,when the average outside air temperature dropped by 1℃, the average inside air temperature at 3270m decreased by 0.2℃. The measured average outside air temperature was 24.75℃, and when the outside air temperature was changed, the inside temperature can be calculated as shown in Equation 7. The initial tunnel surface temperature can be determined by substituting it with the NTU after predicting the air temperature inside the tunnel according to tunnel length:

Here,
αL is the decreased rate of outside air temperature change by tunnel length
βL is the increased value of outside air temperature by tunnel length (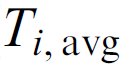 = 4:758℃).
Flow Field An alysis of the Tunnel and Reliability Verification
Flow Field Model of the Tunnel
The correlation between the entrance and midpoint of the tunnel was derived using measurement data to predict the inside air temperature variation by tunnel length.This correlation equation was applied to numerical an alysis to examine the reliability of the inside air temperature prediction. The lowest outside air temperature during the measurement period was 212℃, and a total of four data were selected at 3℃ intervals, as shown in Figure 7. 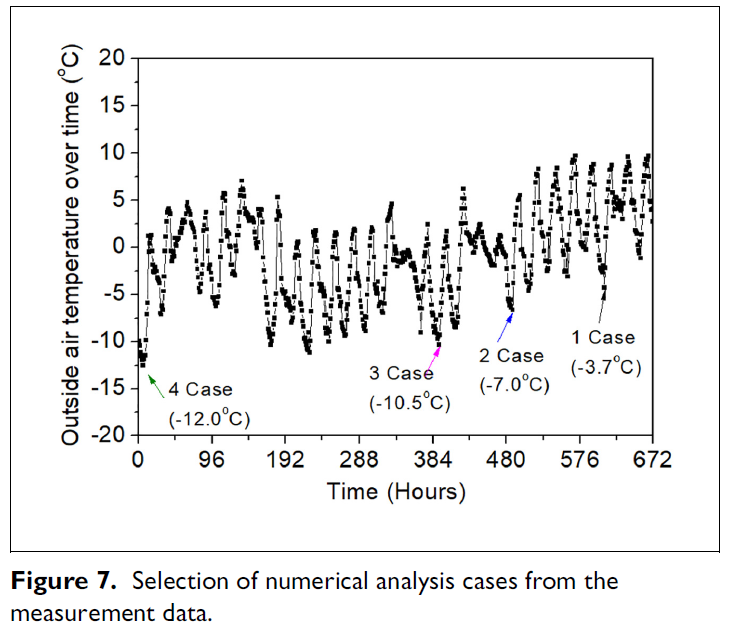
The four cases of outside air temperature were compared with the measurement data to verify the reliability of the an alysis.
In this study, the MIDAS NFX program was used to an alyze the air temperature variations inside the tunnel.The fluid flow field was modeled considering the size and length of the tunnel. The field-tested tunnel cross-section area and half-length (from the entrance to the midpoint) were implemented in the numerical model with the flow field, as shown in Figure 8a. The weather conditions at the tunnel entrance for the boundary conditions were determined based on the type of airflow, the outside air temperature, and the inlet wind speed. The pressure at the midpoint of the tunnel length was set to 0 N/㎡.The average convective heat transfer coefficient (h) was determined for the tunnel surface boundary condition using the second Petukhov equation fitted to large Reynolds numbers. The tunnel surface temperature (Ts)was set by using the number of heat transfer units (NTU).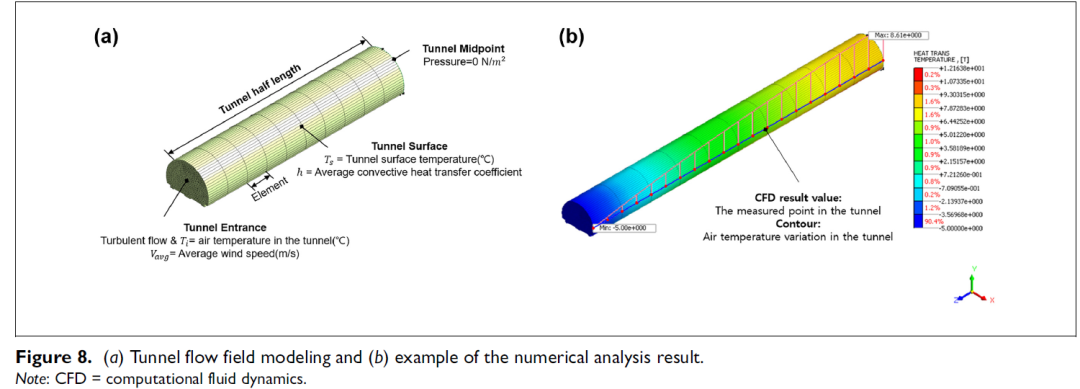
An alysis was implemented to derive the result at 3600 s, which considers the appropriate time for the inside air temperature of the tunnel to converge. Since the thermometer sensor is installed at the height of about 90cm from the tunnel bottom, the air temperature change results were also selected at the same points as the field condition, as shown in Figure 8b.
Boundary Conditions in Computational Fluid Dynamics
A total of four cases (outside air temperatures: 23.7℃,27.0℃, 210.5℃, 212.0℃) of the measurement data were used to implement the convective heat transfer in the tunnel. Flow types and boundary conditions for each a nalysis case were calculated and described as follows using the equations related to convective heat transfer to verify the reliability of the a nalysis method by comparing the numerical a nalysis results and measurement data.
Type of Fluid Flow
The hydraulic diameter should be calculated by using Equation 8 to determine the flow type of a fluid inside a tunnel. The cross-sectional area of the measurement double-track tunnel is 63.7㎡, and its perimeter is 29.20 m. The hydraulic diameter of the tunnel is calculated to be 8.70m by applying the equation below:

Here,
d is the hydraulic diameter (m);
A is the crosssectional area (㎡);
P is the wetted perimeter (m).
The thermal properties are different depending on the air temperature. In the case of a tunnel, the air filling the inside tunnel has thermal properties of the bulk mean air temperature. That mean air temperature can be calculated as the arithmetic average of the tunnel entrance and midpoint air temperatures (9). The bulk mean air temperature for each an alysis case was calculated by using the field data, as shown in Table 2.
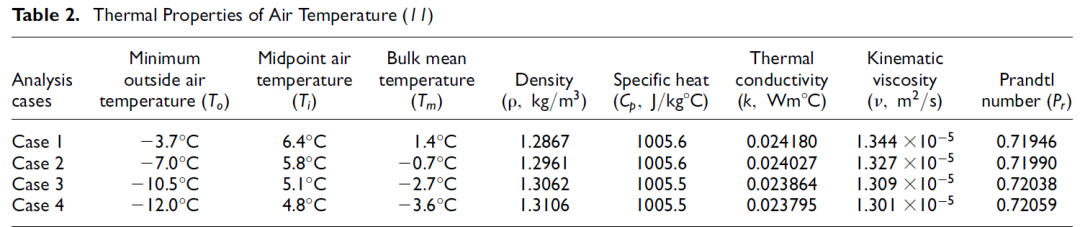
The thermal properties of the bulk mean air temperature (Tm) were referenced from data from the Microelectronics Heat Transfer Laboratory at the University of Waterloo (11).The Reynolds number is 647,776 for an alysis case 1 and 669,433 for a nalysis case 4 by using Equation 8 after
substituting the kinematic viscosity coefficient and the measured tunnel conditions (hydraulic diameter: 8.71m,average inlet wind speed: 1 m/s). In the case of flow over a s mooth tunnel surface, Reynolds numbers (Re) less than 2300 are considered to indicate laminar flow, while Reynolds numbers greater than 10,000 are considered to indicate turbulent flow. Since the flow in the measured tunnel is constructed with a s mooth concrete lining surface and the Reynolds number is greater than 10,000, it can be considered as a turbulent flow:

Here
V is the inlet wind speed (m/s)
y is the kinematic viscosity (㎡/s).
Convection Heat Transfer Coefficient and Tunnel Surface Temperature
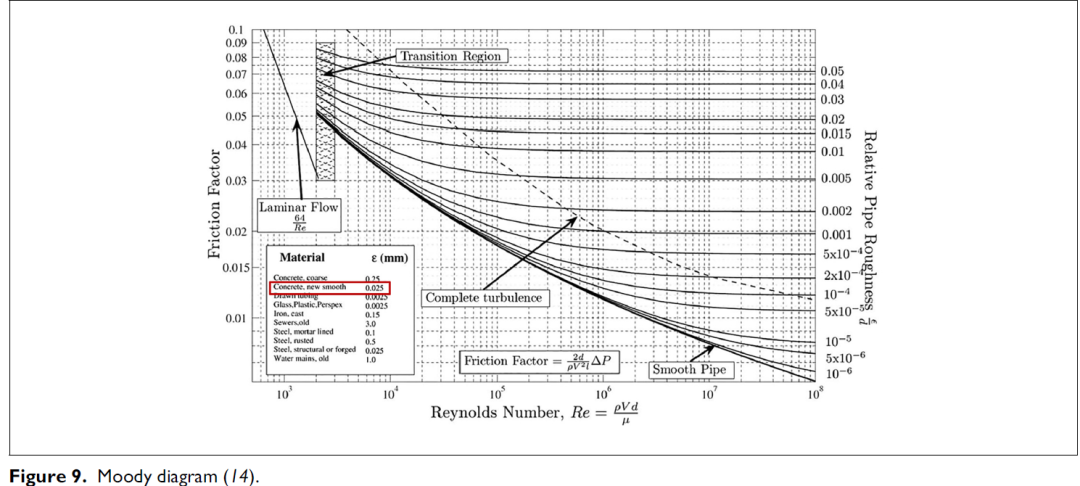
The average convective heat transfer coefficient and tunnel surface temperature must be set as the tunnel surface boundary conditions as well as the fluid flow in numerical an alysis. The Nusselt number (Nu), which indicates how effectively convection is transferred to the solid surface,must be determined first to calculate the average convective heat transfer coefficient. As the tunnel surface is made with concrete lining, and has a s mooth inside surface, turbulence occurs in internal convection. Most correlations for friction and heat transfer coefficients in turbulent flows are based on experimental studies because of theoretical difficulties in dealing with turbulent flow. When the calculated Reynolds number is large, the second Petukhov equation (Equation 10) can be applied with the appropriate Nusselt number (12).The coefficient of friction (f ) can be found in the Moody diagram using the relative surface roughness(ɛ/d) and Reynolds number (Re) in Equation 10. The absolute roughness of various materials was referenced from the data of Miller (13), as shown in Figure 9 The s mooth concrete tube’s absolute roughness (ɛ) was set to 0.025mm. As a result, the relative roughness is 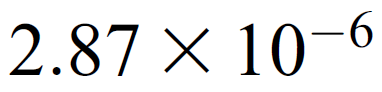 and the friction coefficient is around 0.0125 for an alysis case 4 and 0.0126 for a nalysis case 1 by using the Moody diagram (14). If the physical properties for each an alysis case are applied as shown in Table 2, the Nusselt number (Nu) was calculated to be 765.87 for an alysis case 4 and 778.38 for an alysis case 1:

Here, f is the friction coefficient.
The Nusselt number (Nu) and thermal conductivity for each an alysis case were applied, as shown in Equation10. As a result, the average convective heat transfer coefficient is in the range of 2.10–2.13W/㎡k, as shown in Table 3:

Here, Nu is the Nusselt number and k is thermal conductivity.

The tunnel surface temperatures (Ts) were calculated as shown in Table 3 using the NTU between the air temperatures at the tunnel midpoint (Ti) and outside air temperatures(To) for each an alysis case.
Reliability Verification of the Numerical Model
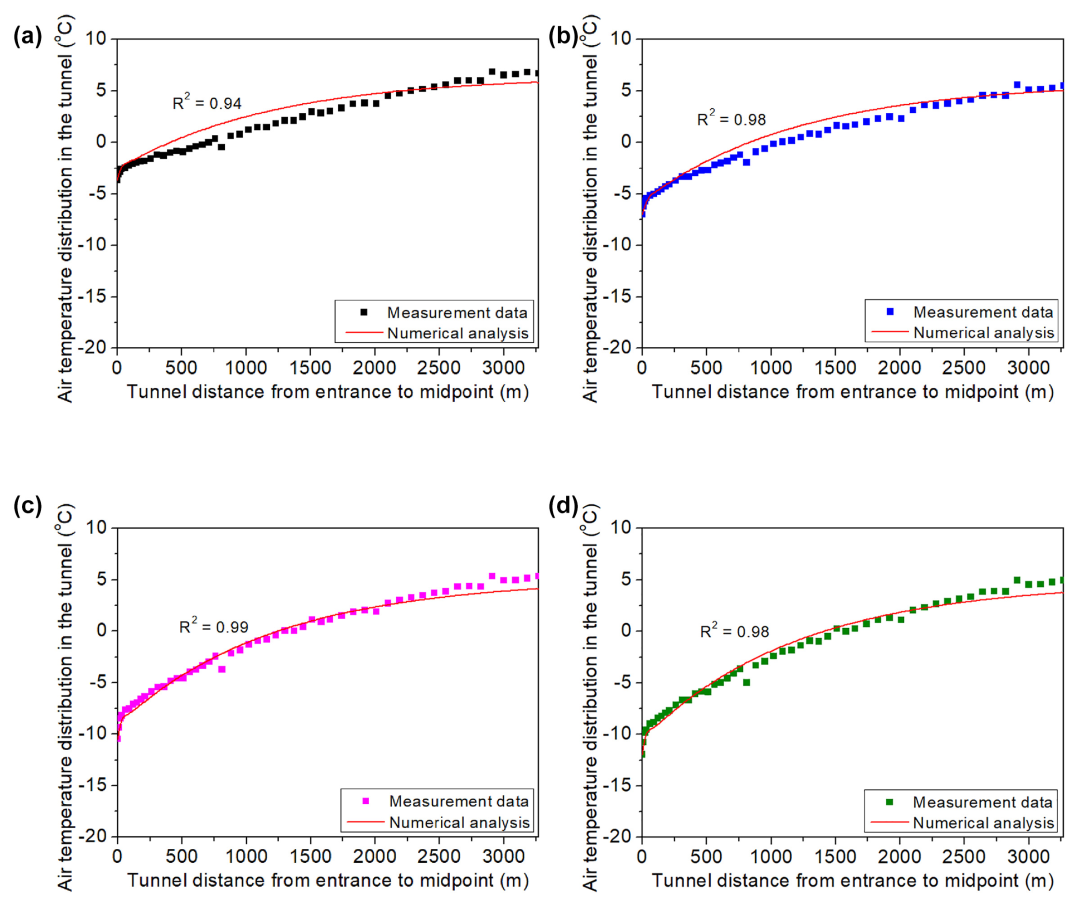
The measurement data and the result of the numerical an alysis were compared and a nalyzed for each case to examine the reliability of the tunnel heat transfer an alysis,as shown in Table 4 and Figure 10.

The inside air temperature distribution through the an alysis was similar to the measurement data for each an alysis case. In particular,the an alysis of the rapid air temperature changes from the entrance to the distance of 90–100 m along the tunnel length was deemed appropriate. Based on the field data, the average coefficient of determination (R²) with the flow a nalysis data was 0.94 or higher, and when the outside air temperature was 27.0℃or lower, it was in the range of 0.97–0.98. The flow an alysis can be expected to predict the air temperature change inside the tunnel properly.

Prediction of Freezing Air Temperature Distribution in the Entire Railway Tunnel
The tunnel cross-sections are mainly designed as double track, and tunnel lengths in cold regions are designed to vary from 1 to 10km in South Korea. The minimum outside air temperatures were between 0℃ and 230℃,and the mean wind speed was about 2 m/s over the past 10 years in South Korea. The tunnel length from the tunnel entrance to the midpoint was modeled from a minimum of 500m to a maximum of 5000m based on the standard cross-section of the double-track tunnel. The outside air temperatures (from 0℃ to 230℃) and inlet wind speed (2 m/s) were set at the tunnel entrance. The tunnel surface temperatures (Ts) for each tunnel length was calculated through the NTU equation for the tunnel surface boundary condition, as shown in Table 5.
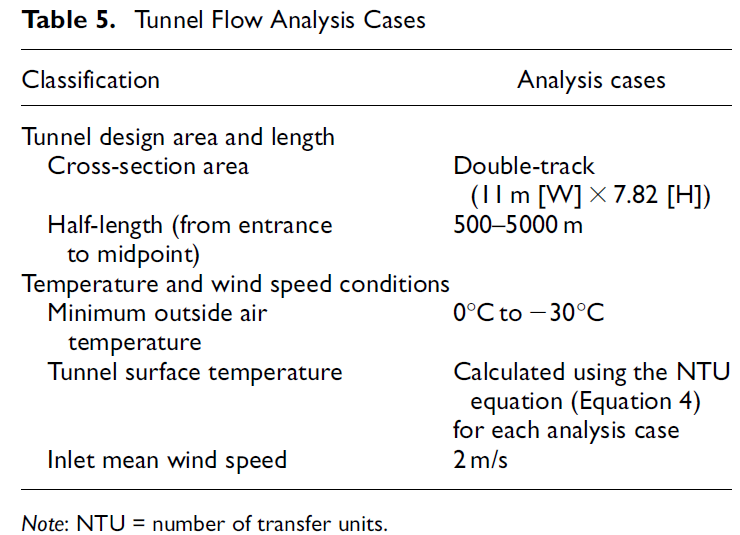
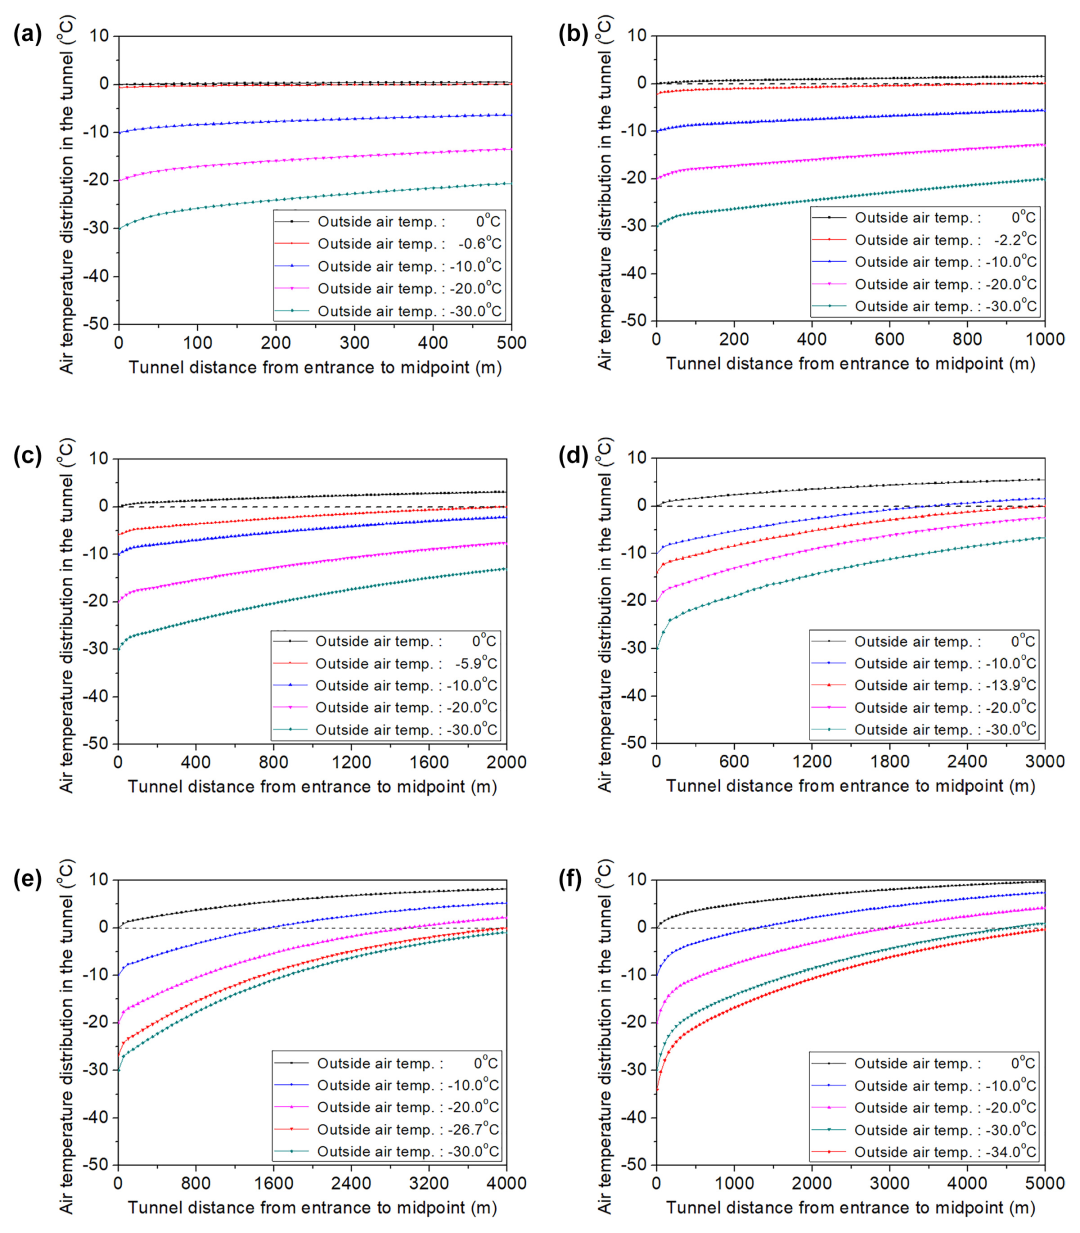

Figure 11 shows the results of the air temperature distribution at the tunnel half-length by heat transfer an alysis.Outside air temperatures that drop the inside air temperature below zero in the entire section were investigated by each half-length. As a result, when the tunnel half-length is 500 m and the outside air temperature is below 20.6℃, the air temperature throughout the entire section is below zero, as shown in Figure 11a. The minimum outside air temperatures causing freezing in the entire section decreased as the tunnel half-lengths increased, as shown in Figure 11, a–f.
Prediction of Freezing Conditions that Drop the Air
Temperature in the Whole Tunnel below Zero
Assuming that the weather conditions at both tunnel entrances (left- and right-hand sides) are identical, it is possible to determine the conditions of freezing air temperature distribution in the entire tunnel. Therefore, the freezing conditions of the minimum outside air temperature and tunnel lengths were investigated under an inlet wind speed of 2 m/s, as shown in Figure 12.
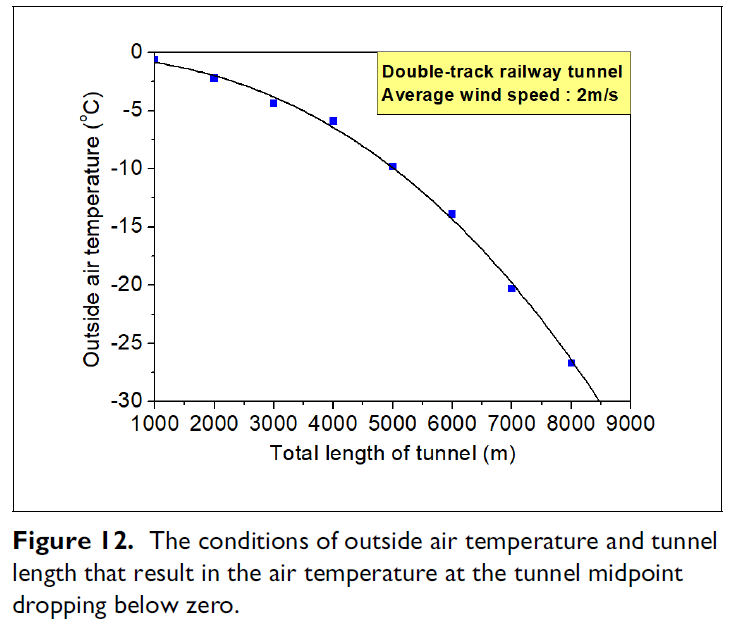
In regions where the outside air temperature is typically below 210.0℃, double-track tunnels with lengths less than 5000 m will experience freezing air temperatures throughout the entire tunnel. Therefore, freezing inside a tunnel can be anticipated for shorter tunnel lengths and lower outside temperatures.
Conclusions
In this study, air temperatures inside the tunnel were measured to predict freezing conditions between the tunnel length and outside air temperature. The characteristic of air temperature variation was an alyzed and applied to the heat transfer a nalysis. The results are as follows.The measuring results inside the double-track tunnel showed that the inside air temperatures gradually increased nonlinearly along the tunnel length from the entrance. The air temperature variation inside the tunnel was similar to the tube heat transfer principle under a constant tunnel surface temperature. A total of four cases were selected at 3℃ intervals from the minimum air temperature (-12℃)and implemented in the numerical an alysis. The results showed an average coefficient of determination (R²) of 0.94 or higher compared with field data.
The minimum outside air temperatures causing freezing temperature in the entire tunnel were investigated by the tunnel length under an inlet wind speed of 2 m/s.Generally, if the outside air temperature drops below -10.0℃ and the tunnel length is shorter than 5000 m, it will cause freezing air temperatures in the entire section.It was found that the risk of freezing air temperature distribution decreases as the tunnel length increases under the same weather conditions. Therefore, the freezing air temperature distribution is related to the tunnel length and the minimum outside air temperature and it could be derived using a tube heat transfer principle similar to the field data.
References
1. NPRA. Road Tunnels: Standard. Statens Vegvesen, Norway,2004.
2. Zhou, X., Y. Zeng, and L. Fan. Temperature FieldAn alysis of a Cold-Region Railway Tunnel Considering Mechanical and Train-Induced Ventilation Effects.Applied Thermal Engineering, Vol. 100, 2016, pp.114–124.
3. Zhao, P., J. Chen, Y. Luo, L. Chen, Y. Li, and C. Wang.Investigation of the Insulation Effect of Thermal Insulation Layer in the Seasonally Frozen Region Tunnel: a Case Study in the Zuomutai Tunnel, China. Advances in Civil Engineering, Vol. 2019, 2019, pp. 1–14.
4. Zhao, P., J. Chen, Y. Luo, Y. Li, L. Chen, C. Wang, and T. Hu. Field Measurement of Air Temperature in a Cold Region Tunnel In Northeast China. Cold Regions Science and Technology, Vol. 171, 2020, p. 102957.
5. He, C., Z. Wu, and L. Zhu. A Convection-Conduction Model for An alysis of the Freeze-Thaw Conditions in the Surrounding Rock Wall of a Tunnel in Permafrost Regions. Science in China Series D: Earth Sciences, Vol.42, 1999, pp. 1–8.
6. Tan, X., W. Chen, D. Yang, Y. Dai, G. Wu, J. Yang, H.Yu, H. Tian, and W. Zhao. Study on the Influence of Airflow on the Temperature of the Surrounding Rock in a Cold Region Tunnel and its Application to Insulation Layer Design. Applied Thermal Engineering, Vol. 67, No.
1–2, 2014, pp. 320–334.
7. Xuefu, Z., L. Yuanming, Y. Wenbing, and Z. Shujuan.Nonlinear An alysis for the Three-Dimensional Temperature Fields in Cold Region Tunnels. Cold Regions Science and Technology, Vol. 35, No. 3, 2002, pp. 207–219.
8. Xuefu, Z., Y. Wenbing, W. Cheng, and L. Zhiqiang.Three-Dimensional Nonlinear An alysis of Coupled Problem of Heat Transfer in the Surrounding Rock and Heat Convection Between the Air and the Surrounding Rock in the Fenghuo Mountain Tunnel. Cold Regions Science and Technology, Vol. 44, No. 1, 2006, pp. 38–51.
9. Cengel, Y. A. Introduction to Thermodynamics and Heat Transfer: McGraw-Hill, New York, 1997.
10. Lee, S., S. Park, J. Kim, K. -H. Cho, and M. Son. Temperature Condition An alysis for Freezing on Tunnel Lining Back Side According to Tunnel Length. Applied Sciences,Vol. 13, No. 24, 2023, p. 13016.
11. Laboratory MHT. Fluid Properties Calculator. http://www.mhtl.uwaterloo.ca/old/onlinetools/airprop/airprop.html.1997.
12. Petukhov, B. S.Heat Transfer and Friction in Turbulent Pipe Flow with Variable Physical Properties. In Advances in Heat Transfer, Elsevier, Amsterdam, Netherlands, 1970.pp. 503–564.
13. Miller, D. Internal Flow Systems, 2nd Edition. BHRA(Information Services). 1999.
14. Moody, L. F. Friction Factors for Pipe Flow. Transactions of the American Society of Mechanical Engineers, Vol. 66,1944, pp. 671–684.
author:
From:

https://sage.cnpereading.com/doi/10.1177/03611981241260702