
Python学习笔记—图例位置设置


在之前的推文中,详细介绍了绘制折线图美化的一个全过程。但是其中还是有很多的小知识点需要我们去学习。只有将每一个小知识点学会,才能绘制出更加美观的图片。
那么我们开始讲解,今天讲解的是plot绘图时,图例位置的设置方法!
图例可设置的位置有如下所示:
| Location String | Location Code |
| best | 0 |
| upper right | 1 |
| upper left | 2 |
| lower left | 3 |
| lower right | 4 |
| right | 5 |
| center left | 6 |
| center right | 7 |
| lower center | 8 |
| upper center | 9 |
| center | 10 |
那我们举几个例子来看一下结果吧:
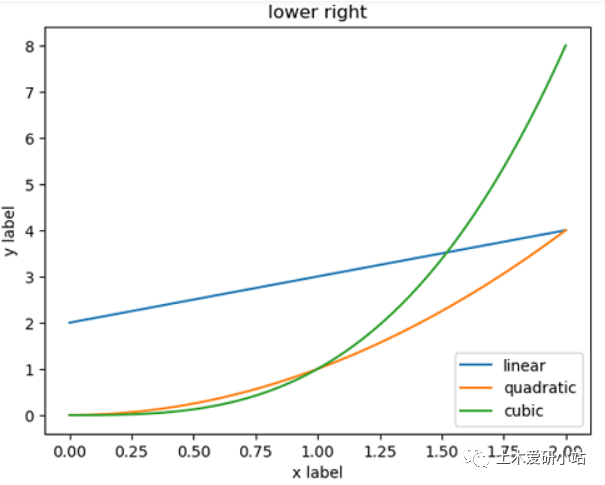
import numpy as npimport matplotlib.pyplot as pltx = np.linspace(0, 2, 100)plt.figure()plt.plot(x, x+2, label='linear')plt.plot(x, x**2, label='quadratic')plt.plot(x, x**3, label='cubic')plt.xlabel('x label')plt.ylabel('y label')plt.title("lower right")plt.legend(loc='lower right')
其结果显示如下:
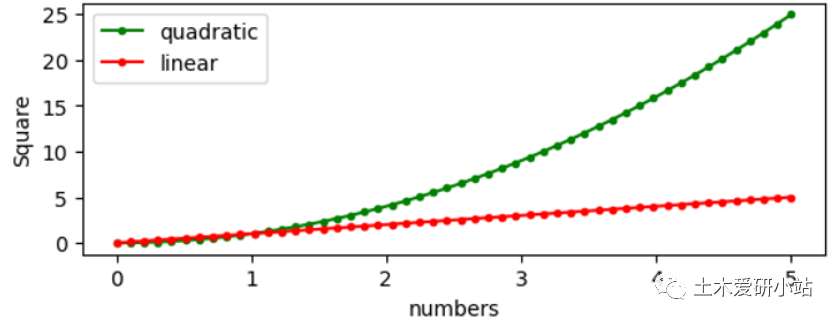
import numpy as npimport matplotlib.pyplot as pltplt.figure()x = np.linspace(0.0, 5.0)y = x*xplt.subplot(2, 1, 2)plt.plot(x, y, 'g.-',label='quadratic')plt.plot(x,x, 'r.-', label='linear')plt.title('uper left')plt.xlabel('numbers')plt.ylabel('Square')plt.legend(loc='uper left')plt.show()
其结果显示如下 :
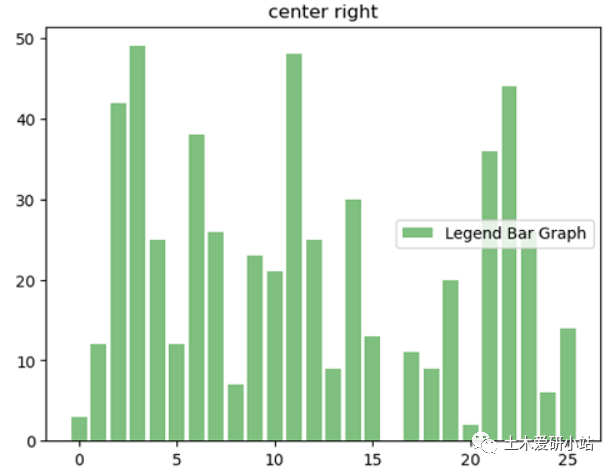
import numpy as npimport matplotlib.pyplot as pltplt.figure()plt.bar(np.arange(26), np.random.randint(0,50,26), alpha = 0.5, color='g', label='Legend Bar Graph')plt.title('center right')plt.legend(loc='center right')
其结果显示如下:
以上就是今天讲解的内容了,希望能够对大家有所帮助!
以上部分内容来源于网络,如果侵权,请联系小编删除!
登录后免费查看全文
著作权归作者所有,欢迎分享,未经许可,不得转载
首次发布时间:2023-08-16
最近编辑:3年前

硕士
不怕困难,勇往直前

相关推荐
最新文章
热门文章
