
Hyperview Python 二次开发,自动为曲线添加标记

愿与您一同,用代码提升效率!
仿真工程师在编写报告时,报告中大量曲线需要标记最大最小值,手动标记耗费时间,使用脚本1秒钟。
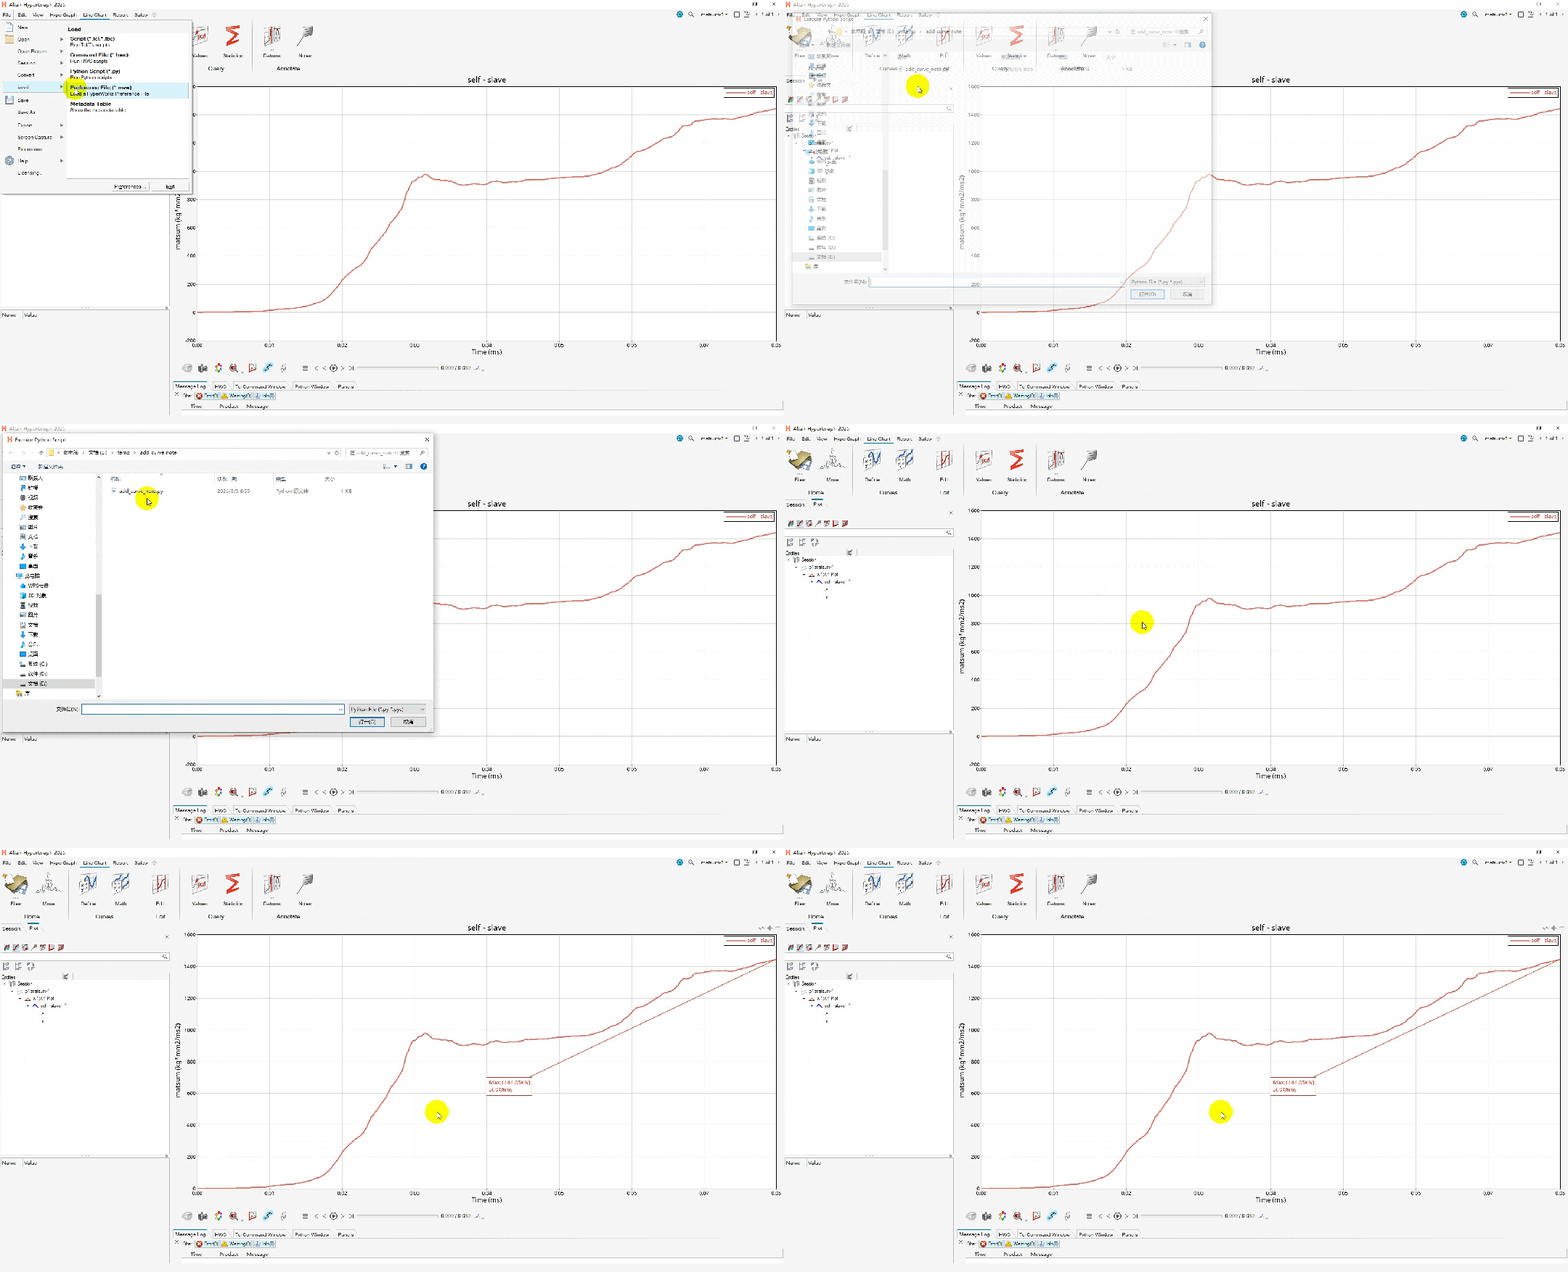
此篇说明怎样通过HyperView二次开发自动标记曲线极值,告别手动标记。
HyperView基于tcl语言实现自动标记曲线极值方法:
Hyperview二次开发之自动曲线绘制(安全带固定点强度加载曲线)
备注:此处超链接,内有基于tcl语言实现曲线极值标记方法
HyperView基于Python语言实现自动标记曲线极值方法:
def add_note_for_curve (curveid,yunit,xunit):
    import hw
    import hw.hg as hg
    ses = hw.Session()
    page = ses.get(hw.Page)
    win = ses.get(hw.Window)
    curve = ses.get(hg.CurveXY,id=curveid)
    #  增加一个note
    note = hg.Note(
        attachTo="curve",
        attachmentCurve= curveid ,
        attachmentPoint="indexofmax(c" + str(curveid) + ".y)",
        text="Max:{y,%3.2f}"+str(yunit)+"}\nat {x,%3.2f}"+str(xunit)+"",
        autoPosition=True,
    #    autoPositionStrategy=autoPos,
        curveColor=True,
    )
    noteid = note.id
    win.update()
    return noteid
add_note_for_curve(1,"KN","ms")
登录后免费查看全文
著作权归作者所有,欢迎分享,未经许可,不得转载
首次发布时间:2026-07-08
最近编辑:3月前

硕士
签名征集中

还没有评论
相关推荐
最新文章
热门文章
