首页/文章/ 详情

学术论文-脉冲式点焊钨极气体保护焊过程中电弧 - 熔池耦合的瞬态统一模型

4月前浏览589

A Transient Unified Model of Arc-Weld Pool Couplings during Pulsed Spot Gas Tungsten Arc Welding 

A. Traidia1, 2, F. Roger*, 1 

1ENSTA Paristech, Department of Mechanics UME 

2AREVA NP, Technical Center  

*Corresponding author: ENSTA Paristech, Department of Mechanics UME, Chemin de la hunière, 91761 Palaiseau , 

FRANCE,  frederic.roger@ensta-paristech.fr 


Abstract: 

A transient finite element model has been developed to study the heat transfer and fluid flow during pulsed spot GTA welding on stainless steel. Temperature field, fluid velocity and electromagnetic fields are computed inside the cathode, arc-plas ma and anode using a unified MHD formulation. The evolution of the heat flux and current density at the top surface of the anode are studied during the welding process. The electric heating flux at the anode which represents the energy absorbed by the workpiece from the electrons coming from the cathode is found to be the major mechanis m of heating. The proposed numerical model also permits to study the time evolution of the weld pool dimensions for both constant and pulsed current. A comparison shows that the use of a pulsed current welding gives a wider and deeper weld shape than the mean constant current welding. The present work lays a foundation for the future development of a three-dimensional model for moving torch arc welding.

Keywords: 

Heat transfer, Fluid flow, Arc plas ma, Unified model, Marangoni effect. 

1、Introduction

Due to the widespread use of GTA welding in the manufacturing industry, the numerical simulation of such a process is currently in great progress. The main goal is to study the impact of the welding parameters (welding current, arc length, pulse frequency, welding speed …) on the final weld shape in order to improve the welding quality and increase productivity. The complexity of the numerical modeling is due the strong couplings between many physics involved in this process. The ionization of the shielding gas ensures the current flow between the two electrodes, then the heating Joule effect creates a thermal plas ma composed of electrons, ions and neutral species at a large temperature range; from 300 K to more than 20 000 K. The workpiece is then heated from both the arc-plas ma conduction, and the electrons flow at the top surface. Depending on the melting temperature of the workpiece, a weld pool is formed in which the fluid flow is governed by the Marangoni effect at the top surface, the buoyancy forces and the electromagnetic forces created by the current flow. The fluid flow inside the weld pool is also strongly coupled to the temperature field and the deformation of the top free surface.

Many numerical models of spot GTAW are available in the literature [1-5]. Most of them consider only one part of the welding process [1 4] (either the cathode, or the arc plas ma, or the anode) which leads to fix some boundary conditions that do not represent the real situations. The best way to deal with the problem is to take into account the three parts (anode, cathode and arc-plas ma) in a unified formalis m. The interfaces between the plas ma and the electrodes are then considered as internal boundaries. This approach was proposed by Lowke and Tanaka et al [5] and gives satisfying results for constant current welding.

In the present work, a unified finite element model is introduced taking into account the three parts of the welding process. The time-dependent model can simulate pulsed current welding in which the welding current varies with time at a given frequency between two constant values; the peak current and the background current. This permits to study the transient evolution of some physical quantities at the transition between the peak and background times but also to compare welding under pulsed current with welding under the mean corresponding constant current.

2. Mathematical formulation

1.1 Governing equations  

The mathematical formulation is based on the following assumptions: 

         The study is restricted to spot GTAW; an axisymmetric coordinate system is used. 

         The arc column is assumed to be pure argon at Local Thermodynamic Equilibrium. 

         The gas plas ma and molten metal are incompressible.  

         A weak coupling is considered between the free surface deformation and the Magneto Hydrodynamic (MHD) calculations. 

The temperature, velocity and pressure fields are calculated in the three domains using the classical conservation equations written in a unified transient formalis m as follows: 
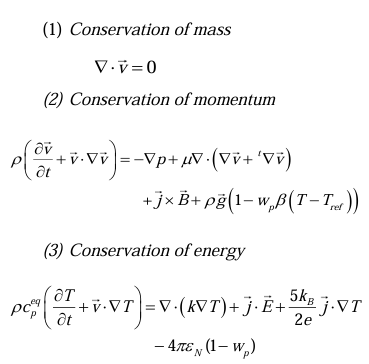
image.png

Where image.png is velocity, T is temperature, ρ is pressure, ρ is density,image.png is an equivalent specific heat that takes into account the latent heat of fusion image.png is the liquid fraction assumed to vary linearly with temperature in the mushy zone and image.png equals 1 in the weld pool and 0 elsewhere.  k is  thermal conductivity and μ is the viscosity. The Boussinesq approximation is used to compute the convection forces inside the weld pool. β is the metal thermal expansion andimage.png  is taken as the solidus temperature. 
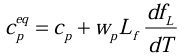
In the weld pool the volumetric heat source is the Joule effect and the enthalpic flux, and in the arc plas  ma we take in addition the radiation losses, usually approximated byimage.png , where image.png is the net emission coefficient of argon that varies with temperature. The determination of the electromagnetic forces and the joule effect in both arc plas ma and work piece requires the computation of the current density j and the magnetic fluxB. To achieve this, the coupled current continuity and the magnetic potential equations are computed as function of the electric potential V and the magnetic potential vector A  as follows:
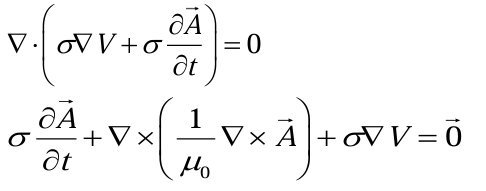
image.png

The current density, electric field and magnetic flux are then computed from V and A as follows:  

image.png

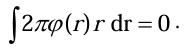
It is important to notice that the eddy current image.png created by the time variation of the welding current is taken into account in the above expressions. The free surface deformation φ(r) is described by the following PDE obtained from [2]:
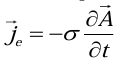
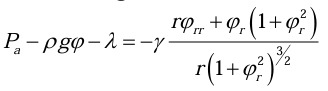
image.png

Where φ is the free surface depression, Pa is the arc pressure, γ is the molten metal surface tension and λ is a Lagrangian multiplier used to take into account the mass conservation constraint:image.png
1.2 Boundary conditions 

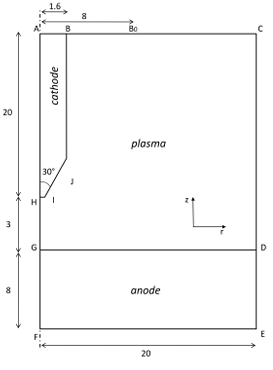
The computational domain is shown in Figure 1. As seen the worpiece is  made of two subdomains in order to use a finer mesh size for the weld pool formation. All the boundary conditions are listed in Table 1; the most important points are discussed below;

At the interface between arc plas ma and the anode (GD) the following conditions  must be satisfied [5]:
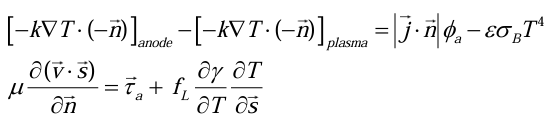
image.png

image.png

Figure 1. Computational domain (dimensions in mm) 

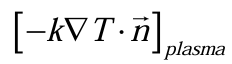
The first condition shows that the normal heat flux at the anode is composed by the heating conduction flux from the plas ma, the heating electric flux (which represents the energy transferred from the electrons to the anode) and the cooling radiation losses. image.png is the anode work function and image.pngis the Stefan-Boltzmann constant. 

The second condition means that the total shear stress is the sum of the arc drag force and the Marangoni force. image.png and image.png are respectively a local tangent vector and the normal vector to the top free surface (n is directed toward the plas ma domain). image.png is the surface tension coefficient, which has been reported to have a big impact on the flow directions inside the weld pool [1-4]. Its dependence on temperature T and sulfur activity image.png is considered using the expression developed by Sahoo and DebRoy et al [6] as follows:
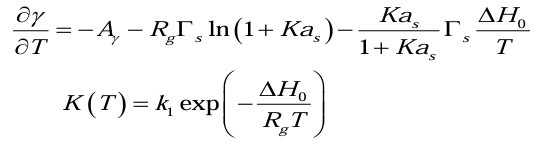
image.png

Along the interface between the arc plas ma and the cathode (HIJB), the normal discontinuity of the heat flux is expressed as follows:

image.png

Where i V and c are respectively the argon ionization potential and the cathode work function. i j and e j are respectively the ion current and electron current calculated from:
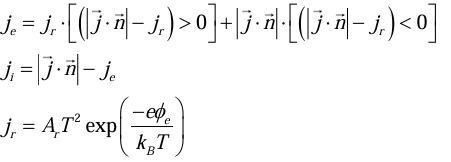
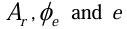
image.png

image.png are respectively the Richardson’s constant, the effective work function for thermionic emission and the elementary charge.

Table 1: Boundary conditions
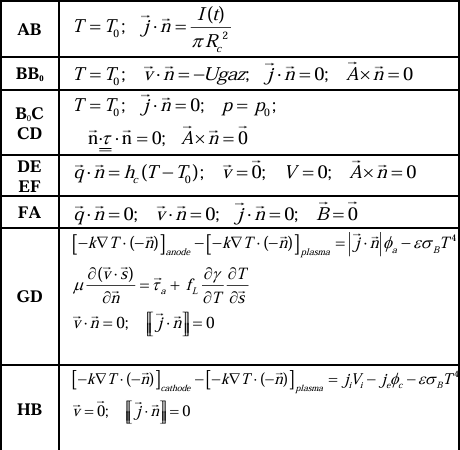
image.png

3. Numerical simulation results 

The numerical model is applied to an AISI 304 stainless steel disk containing 290 ppm sulfur with 8 mm thickness.  The thermophysical properties of AISI 304 ss are listed in the appendix. The properties of pure argon are taken from [7]. The gas inflow rate is fixed to 30 L/min. Table 2 lists the other welding parameters.

Table 2: Welding parameters
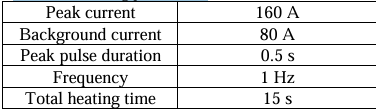
image.png

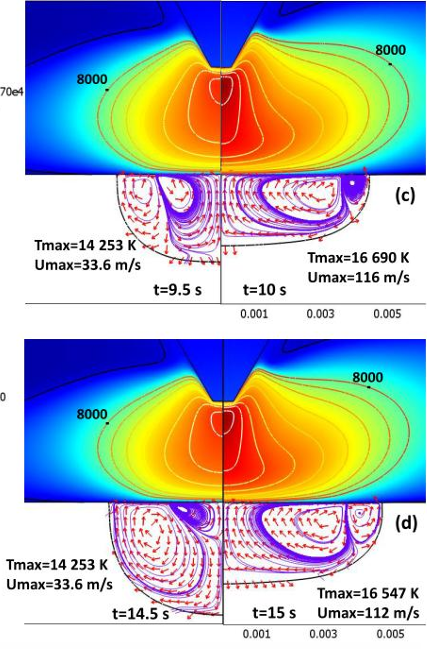
Figure 2 presents the time evolution of the computed solution at the end of the background time (left) and the peak time (right) every five periods. It is represented the temperature field and temperature contours inside the arc plas ma and the electrode, the normalized velocity field and streamlines inside the molten weld pool. 

During the peak time the arc is bell-shaped and the maximum of temperature and velocity fields are higher than during the background time. The obtained values for the maximum of plas ma-jet velocity and plas ma temperature are in good agreement with the literature, in fact for a 150 A continuous current welding 17000 K for the maximum temperature and 150 m/s for the maximum velocity are reviewed [5].  We can also notice that the variations of temperature and velocity fields inside the plas ma column between the peak times are negligible; this is also the case for the background times.
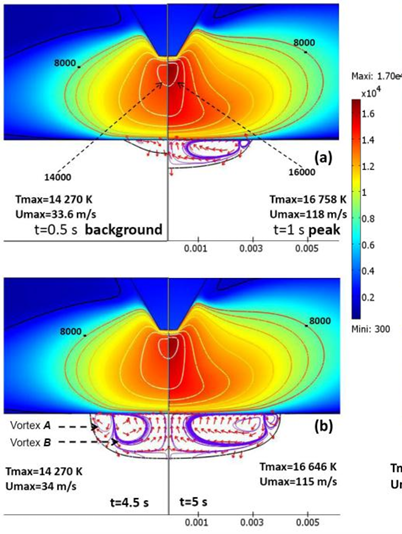
image.png

The dynamic of the weld pool flow is studied by considering the streamlines of the velocity field. We can clearly identify in each figure two vortices named A and B. They results from the Marangoni effect at the top surface of the weld pool, the size of each vortex is related to both temperature distribution at the surface and sulfur content of the workpiece. Details about the dynamic variation of these vortices and their influence on the weld pool evolution are available in our previous works [4]. 

Figure 3 shows the anodic heat flux distribution during the transition from the last peak time (t=14.5 s) to the last peak time (15 s). During the background time the maximum of anodic flux is around 43 W/mm². The transition is then very fast; in approximately 15 μs the heat flux seems to stabilize especially at the center of the disk and reaches a maximum of 56.6 W/mm². The numerical model permits to study the energy transfer between the arc plas ma and the workpiece. Figure 4 shows the radial evolution of the heat flux at the anode at the last peak and background times (t=14.5 s and t=15 s). In each figure it is represented the total heat flux and its elementary contributions, namely; the electric flux image.png, the conduction from the arc plas ma image.pngand the radiation lossesimage.png.  
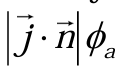
image.png

Figure 2. MHD solutions at background times (left) and peak times (right) for different periods
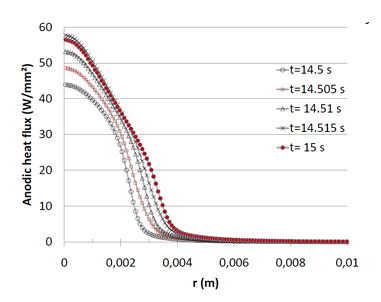
image.png

Figure 3. Evolution of the anodic heat flux at the transition between the background to the peak time
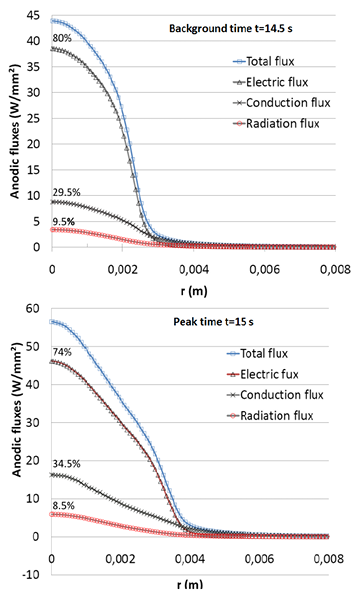
image.png

Figure 4. Anodic heat flux and its elementary contributions at the last period of heating

The electric flux is found to be the most significant factor in both peak and background times. It represents around 80 % of the total energy transferred to the workpiece. The contribution of the conductive heat flux from the plas ma represent around 30 % and the cooling radiation losses are under 10 % of the total heat flux. 

Figure 5 shows the time evolution of the weld pool half-width and depth for the pulsed current 80/160 A and the continuous  mean current 120 A Even though the two cases are energetically equivalent, the pulsed case produces a deeper and wider weld pool than the continuous case, especially for the weld pool depth. This conclusion goes with what is commonly observed by welders.  
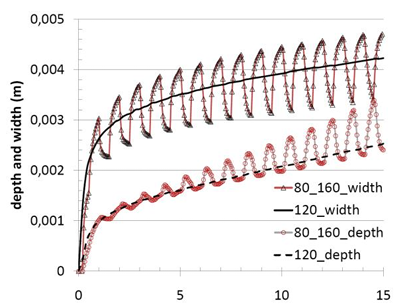
image.png

Figure 5. Evolution of the weld pool size for the pulsed current 80/160 A and the mean current 120 A

4. Conclusions

A transient unified model of pulsed spot GTAW has developed using COMSOL Multiphysics. The numerical simulation allowed a better understanding of the heat transfer between the arc plas ma and the electrodes. The heating thermionic emission at the anode was found to be the most important heating effect. The results showed that for a given level of energy, it is  more interesting to use a pulsed current welding than the mean constant current to get a better weld size. 

5. References  

  1. W.H. Kim and S.J. Na. Int. J. Heat Mass Tran. , 41, 3213-3227 (1998)

  2. H.G. Fan, H.L. Tsai and S.J. Na. Int. J. Heat Mass Tran. , 44, 417-428 (2001)  

  3. F. Lu, S. Yao, S. Lou and Y. Li. Comput. Mater. Sci., 29, 371-378 (2004)

  4. A. Traidia, F. Roger and E. Guyot. Int. J. Therm. Sci., 49, 1197-1208 (2010)

  5. M. Tanaka and J.J. Lowke. J. Phys. D: Appl. Phys., 40, R1-R23 (2007)

  6. P. Sahoo, T. DebRoy, M.T. McNallan. Metall. Trans. B., 19B, 483-491 (1988)

  7. P. Fauchais, M. Boulos and E. Pfender, Thermal plas ma, fundamentals and applications, (1994)

6. Acknowledgements

This research was supported by the Technical Center of welding at AREVA NP, FRANCE. The authors are grateful to Lahcene Cherfa, Alexander Chidley and Catherine Holm for their help on the results processing. 


Appendix 

Table 3: Material properties of the used materials.
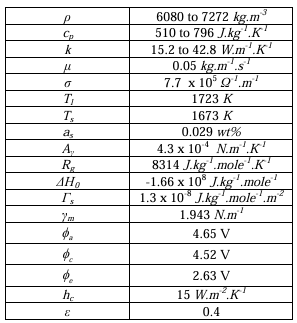
image.png

免责声明:

本页面/内容部分素材来源于互联网公 开 信 息,旨在传递更多信息,不代表本平台立场。

版权归原作者或机构所有,如涉及侵权,请通过平台联系我们,我们将在核实后第一时间处理。

本平台对转载内容的真实性、准确性不作任何保证,用户需自行判断并承担使用风险。

Comsol
著作权归作者所有,欢迎分享,未经许可,不得转载
首次发布时间:2026-04-07
最近编辑:4月前
仿真支持爱好者
在仿真的路上越走越远
获赞 333粉丝 21文章 318课程 0
点赞
收藏
作者推荐

几百种材料的应力应变拉伸曲线图集_前半部分

AtlasofStress-StrainCurvesSecondEditionCopyright◎2002byASMInternational®AllnightsreservedNopartofthisbookmaybereproduced,storedinaretrievalsystem,ortransmitted,inanyformorbyanymeans,electronic,mechanical,photocopying,recording,orotherwise,withoutthewrittenpermissionofthecopyrightowner.Firstprinting,December2002Greatcareistakeninthecompilationandproductionofthisbook,butitshouldbemadeclearthatNOWARRANTIES,EXPRESSORIMPLIED,INCLUDING,WITHOUTLIMITATION,WARRANTIESOFMERCHANTABILITYORFITNESSFORAPARTICULARPURPOSE,AREGIVENINCONNECTIONWITHTHISPUBLICATION.AIthoughthisinformationisbelievedtobeaccuratebyASM,ASMcannotguaranteethatfavorableresultswillbeobtainedfromtheuseofthispublicationalone.Thispubli-cationisintendedforusebypersonshavingtechnicalskill,attheirsolediscretionandrisk.SincetheconditionsofproductormaterialuseareoutsideofASM'scontrol,ASMassumesnoliabilityorobligationinconnectionwithanyuseofthisinformation.Noclaimofanykind,whetherastoproductsorinformationinthispublication,andwhetherornotbasedonnegligence,shallbegreaterinamountthanthepurchasepriceofthisproductorpublicationinrespectofwhichdamagesareclaimed.THEREMEDYHEREBYPROVIDEDSHALLBETHEEXCLUSIVEANDSOLEREMEDYOFBUYER,ANDINNOEVENTSHALLEITHERPARTYBELIABLEFORSPECIAL,INDIRECTORCONSEQUENTIALDAMAGESWHETHERORNOTCAUSEDBYORRESULTINGFROMTHENEGLIGENCEOFSUCHPARTY.Aswithanymaterial,evaluationofthematerialunderend-useconditionspriortospecificationisessential.Therefore,specifictestingunderactualconditionsisrecommended.Nothingcontainedinthisbookshallbeconstruedasagrantofanyrightofmanufacture,sale,use,orreproduction,incon-nectionwithanymethod,process,apparatus,product,composition,orsystem,whetherornotcoveredbyleterspatent,copyright,ortrademark,andnothingcontainedinthisbookshallbeconstruedasadefenseagainstanyallegedinfringementofletterspatent,copy-right,ortrademark,orasadefenseagainstliabilityforsuchinfringement.Comments,criticisms,andsuggestionsareinvited,andshouldbeforwardedtoASMInternational.PreparedunderthedirectionoftheASMInternationalTechrnicalBookCommittee(2001-2002),CharlesA.Parker,Chair:PreparedwithassistancefromtheASMInternationalMaterialsPropertiesDatabaseCommittee,PJ.Sikorsky,Chair.ASMInternationalstaffwhoworkedonthisprojectincludedCharlesMoosbrugger,TechnicalEditor;VeronicaFlint,AcquisitionsEditor;BonnieSanders,ManagerofProduction;CarolTerman,ProductionProjectManager;andScotHenry,AssistantDirectorofReferencePublications.LibraryofCongressCataloging-in-PublicationDataAtlasofstress-straincurves.—2nded.p.cm.SAN:204-586—T.p.verso.ISBN:0-87170-739-X1.Stress-straincurves—Atlases.2.Metals—Testing.I.ASMInternational.TA460.A862002620.1'63—dc212002027674ASMInternational®MaterialsPark,OH44073-0002www.asminternationalorgPrintedintheUnitedStatesofAmericaContentsPreface........................................................................................................................................ivRepresentationofStress-StrainBehavior..................................................................1FerrousMetals....................................................................................................................21CastIron(CI)........................................................................................................................23CarbonSteel(CS)..............................................................................................................67AlloySteel(AS)..................................................................................................................93High-StrengthSteel(HS).............................................................................................129StainlessSteel(SS).........................................................................................................161ToolSteel(TS)...................................................................................................................269NonferrousMetals.........................................................................................................277CastAluminum(CA)......................................................................................................279WroughtAluminum(WA)............................................................................................299AluminumLaminates(LA).........................................................................................503Copper(Cu)..........................................................................................................................515Magnesium(Mg)...............................................................................................................555Nickel(Ni)...........................................................................................................................631ReactiveandRefractoryMetals(RM)................................................................705Titanium(Ti).......................................................................................................................729PureMetalsandMiscellaneousAlloys(MA)................................................799AlloyIndex..................................................................................................................809UNSIndex........................................................................................................................815PrefaceInthisinformationage,mechanicalpropertydataareplentiful.However,locatingneededinformationquickly,judgingthevalidityofthedata,andmakingreasonedcomparisonsofdatacanbedaunting.Stress-straincurvescondensemuchinformationaboutthemechanicalbehaviorofmetalsintoaconvenientform.Fromthesebasiccurvestheengineercanextractsuchinformationasthestrength,ductility,forma-bility,elasticity,andotherinformationusefulinpredictingtheper-formanceofaparticularalloyunderstress.ASMInternationalpublishedthefirsteditionoftheAtlasofStress-StrainCurves,acollectionofover550curves,in1986.Thisbook,alongwiththeAtlasofFatigueCurves,AtlasofCreepandStress-RuptureCurves,andtheAtlasofStress-CorrosionandCorrosionFatigueCurves,hasformedasetofusefulmaterialspropertyresourcesfortheengineer,materialsscientist,anddesigner.Welloverthreeyearsago—withtheencouragement,assistance,andguidanceoftheASMTechnicalBooksandMaterialsPropertiesDatabaseCommittees—ASMInternationalembarkedontheprojecttocreatethisupdated,expanded,andimprovedSecondEditionoftheAtlasofStress-StrainCurves.Someoftheoverridinggoalsofthisprojecthavebeento:●Addcurvesformaterialsthatareespeciallyusefultokeyindustries,includingaerospace,automotive,andheavymanufacturingSeekoutcurveswitha“pedigree”soreaderscantracethesourceoftheinformationandhavesomeindicationregardingitsreliability●Includeasmuchpertinentinformationaspossibleforeachcurve.Factorssuchasheat-treatcondition,productform,thickness,spec-imensize,orientation,history,testingtemperature,andtestingrateallaffectmaterialsperformanceandmaybehelpfulwheninter-pretingthecurves●NormalizethepresentationofthecurvestofacilitatecomparisonsamongdifferentmaterialsWefeelASMInternationalhasbeenreasonablysuccessfulinachievingtheseobjectivesinthiseditin.Manypeopleareinvolvedinaprojectofthissize,andwewouldliketothankthosewhohavecontributedto,orassisted,thiseffortFirstandforemost,ASMInternationalthanksthematerialsresearcherswhocreatedtheoriginalcurves--withouttheireffortsthisvolumewouldnotexist.DonnaM.Walker,FASM,StressolversInc.,andVeronicaFlint,ASMstaff,initiatedtheprojecttoreviseandexpandthisbook.ASMInternationalthanksthemfortheireffortsinhelpingtodefinethegoalsforthisprojectandinacquiringmanyofthenewcurvestobeaddedtothebook.SpecialthanksareextendedtoSpecialMetals,GilKaufman,FASM,KaufmanAssociates,andBuceBoardman,FASM,Deere&Company,fortheircontributionsofstress-straincurves.HiroOkamotoandhisassociatesperformedthehugetaskofredrawingthecurvestonormalizetheirpresentation,andwearegrate-fulfortheiraccurateandtimelywork.Theorganizationandfinalqualityofthedataasseeninthebookaremyresponsibility,andanyerrors,omissions,ormisclassificationsofalloysaremine.IthankHeatherLampman,theprincipalcopyedi-tor,andthemembersoftheASMInternationalproductionstaff,whohaveworkeddiligentlytokeepanyerrorstoaminimum.However,inanyendeavorofthisscope,therewillbemistakes.Corrections,com-ments,andcriticismsareinvited.Itshouldbenotedthatmostofthedataincludedinthisbookarenotspecifiedasbeingminimum,typical,orhavinganydefinedconfi-dencelevelassociatedwiththem.Thereadermaywanttorefertothesourceofaparticularcurvetofindadditionaldetails.The"Introduction"inthisbookprovidesareviewoftheinformationthatcanbeextractedfromstress-straincurves,aclarificationoftermsusedindescribingmechanicalbehavior,andaguidetothelimitationsoftheaccuracyandprecisionoftheinformationgiven.CharlesMoosbruggerTechnicalEditorASMInternationalRepresentationofStress-StrainBehaviorCharlesMoosbrugger,ASMInternationalITISAPPROPRIATEthatacollectionofstress-straincurvesisnamedanatlas.Anatlasisacollectionoffigures,charts,ormaps,SonamedbecauseearlybookspicturedtheGreekTitan,Atlas,onthecoverortitlepage,strainingwiththeweightoftheworldandheavensonhisshoulders.Thisconceptofvisualizingthereactiontomechani-calstressiscentraltodevelopmentanduseofstress-straincurves.Thisintroductorysectionprovidesareviewofthefundamentalsofthemechanicaltestingthatisrepresentedinthecurves.Themathemat-icalinterpretationofaspectsofthecurveswillaidinanalysisofthecurves.Alistoftermscommontostress-strainbehaviorisgivenattheendofthissection.(Ref1,2).TensileTestingThesimplestloadingtovisualizeisaone-dimensionaltensiletest,inwhichauniformslendertestspecimenisstretchedalongitslongcen-tralaxis.Thestress-straincurveisarepresentationoftheperformanceofthespecimenastheappliedloadisincreasedmonotonicallyusuallytofracture.Stress-straincurvesareusuallypresentedas:●“Engineering”stress-straincurves,inwhichtheoriginaldimensionsofthespecimensareusedinmostcalculations.●"True"stress-straincurves,wheretheinstantaneousdimensionsofthespecimenateachpointduringthetestareusedinthecalcula-tions.Thisresultsinthe“true”curvesbeingabovethe“engineer-ing”curves,notablyinthehigherstrainportionofthecurves.Thedevelopmentofthesecurvesisdescribedinthefollowingsec-tions.Todocumentthetensiontest,anengineeringstress-straincurveisconstructedfromtheload-elongationmeasurementsmadeonthetestspecimen(Fig.1).Theengineeringstress,S,plottedonthisstress-straincurveistheaveragelongitudinalstressinthetensilespecimen.Fig.1Engineeringstress-straincurve.Intersectionofthedashedlinewiththecurvedeterminestheoffsetyieldstrength.Itisobtainedbydividingtheload,P,bytheoriginalareaofthecrosssec-tionofthespecimen,Ao:Thestrain,e,plottedontheengineeringstress-straincurve,istheaver-agelinearstrain,whichisobtainedbydividingtheelongationofthegagelengthofthespecimen,δ,byitsoriginallength,Lo:Becauseboththestressandthestrainareobtainedbydividingtheloadandelongationbyconstantfactors,theload-elongationcurvehasthesameshapeastheengineeringstress-straincurve.Thetwocurvesfre-quentlyareusedinterchangeably.Theunitsofstressareforce/lengthsquared,andthestrainisunitless.Thestrainaxisofcurvestraditionallyaregivenunitsofin./in.ormm/mmratherthanbeinglistedasapurenumber.Strainissometimesexpressedasapercentelongation.Theshapeofthestress-straincurveandvaluesassignedtothepointsonthestress-straincurveofametaldependonits:●Composition●Heattreatmentandconditioning●Priorhistoryofplasticdeformation●Thestrainrateoftest●Temperature●Orientationofappliedstressrelativetothetestspecimensstructure●SizeandshapeTheparametersthatareusedtodescribethestress-straincurveofametalarethetensilestrength,yieldstrengthoryieldpoint,ultimateten-silestrength,percentelongation,andreductioninarea.Thefirstthreearestrengthparameters;thelasttwoindicateductility.Thegeneralshapeoftheengineeringstress-straincurve(Fig.1)requiresfurtherexplanation.Thiscurverepresentsthefullloadingofaspecimenfrominitialloadtorupture.Itisa“full-range”curve.Oftenengineeringcurvesaretruncatedpastthe0.2%yieldpoint.ThisisthecaseofmanyofthecurvesinthisAtlas.Othertestdataarepresentedasa“full-range”curvewithan“expandedrange”todetailtheinitialpartsofthecurve.LinearSegmentofCurvesFromtheorigin,0,theinitialstraight-lineportionistheelasticregion,wherestressislinearlyproportionaltostrain.Whenthestressisremoved,ifthestraindisappears,thespecimenisconsideredcom-pletelyelastic.Thepointatwhichthecurvedepartsfromthestraight-linepropor-tionality,A,istheproportionallimit.Modulusofelasticity,E,alsoknownasYoung'smodulus,istheslopeofthisinitiallinearportionofthestress-straincurve:whereSisengineeringstressandseisengineeringstrain.Modulusofelasticityisameasureofthestiffnessofthematerial.Thegreaterthemodulus,thesteepertheslopeandthesmallertheelasticstrainresult-ingfromtheapplicationofagivenstress.Becausethemodulusofelas-ticityisneededforcomputingdeflectionsofbeamsandotherstructuralmembers,itisanimportantdesignvalue.Themodulusofelasticityisdeterminedbythebindingforcesbetweenatoms.Becausetheseforcescannotbechangedwithoutchangingthebasicnatureofthematerial,themodulusofelasticityisoneofthemoststructure-insensitiveofthemechanicalproperties.Generally,itisonlyslightlyaffectedbyalloyingadditions,heattreat-ment,orcoldwork(Ref3).However,increasingthetemperaturedecreasesthemodulusofelasticity.Atelevatedtemperatures,themod-ulusisoftenmeasuredbyadynamicmethod(Ref4).TypicalvaluesofmodulusofelasticityforcommonengineeringmaterialsaregiveninTable1(Ref5).Resilienceistheabilityofamaterialtoabsorbenergywhendeformedelasticallyandtoreturnitwhenunloaded.Thispropertyusu-allyismeasuredbythemodulusofresilience,whichisthestrainenergyperunitvolume,Uo,requiredtostressthematerialfromzerostresstotheyieldstress,Sx.Thestrainenergyperunitvolumeforanypointonthelineisjusttheareaunderthecurve:Fromthedefinitionofmodulusofelasticityandtheabovedefinition,themaximumresilienceoccursattheyieldpointandiscalledthemod-ulusofresilience,UR:Thisequationindicatesthattheidealmaterialforresistingenergyloadsinapplicationswherethematerialmustnotundergopermanentdistor-Table1TypicalvaluesformodulusofelasticityFig.2Stress-straincurvesforselectedsteels.Source:Ref7tion,suchasmechanicalsprings,isonehavingahighyieldstressandalowmodulusofelasticity.Forvariousgradesofsteel,themodulusofresiliencerangesfrom100to4500kJ/m³(14.5to6501bf·in./in.³),withthehighervaluesrep-resentingsteelswithhighercarbonoralloycontents(Ref6).ThiscanbeseeninFig.2,wherethemodulusofresilienceforthechromium-tungstenalloywouldbethegreatestofthesteels,becauseithasthehighestyieldstrengthandsimilarmodulusofelasticity.ThemodulusofresilienceisrepresentedasthetriangularareasunderthecurvesinFig.3.Figure2showsthatwhilethemodulusofelasticityisconsistentforthegivengroupofsteels,theshapesofthecurvespasttheirpropor-tionalitylimitsarequitevaried(Ref7)Fig.3Comparisonofstress-straincurvesforahigh-strengthhigh-carbonspringsteelandalower-strengthstructuralsteel.PointAistheelasticlimitofthespringsteel;pointBistheelasticlimitofthestructuralsteel.Thecross-hatchedtrian-glesarethemodulusofresilience(UR).Thesetwoareasaretheworkdoneonthematerialstoelongatethemortherestoringforcewithinthematerials.NonlinearSegmentofCurvestoYieldingTheelasticlimit,B,onFig.1,maycoincidewiththeproportional-itylimit,oritmayoccuratsomegreaterstress.Theelasticlimitisthemaximumstressthatcanbeappliedwithoutpermanentdeformationtothespecimen.Somecurvesexhibitadefiniteyieldpoint,whileothersdonot.Whenthestressexceedsavaluecorrespondingtotheyieldstrength,thespecimenundergoesgrossplasticdeformation.Iftheloadissubsequentlyreducedto0,thespecimenwillremainpermanentlydeformed.MeasuresofYielding.Thestressatwhichplasticdeformationoryieldingisobservedtobegindependsonthesensitivityofthestrainmeasurements.Withmostmaterials,thereisagradualtransitionfromelastictoplasticbehavior,andthepointatwhichplasticdeformationbeginsisdifficulttodefinewithprecision.Intestsofmaterialsunderuniaxialloading,threecriteriafortheinitiationofyieldinghavebeenused:theelasticlimit,theproportionallimit,andtheyieldstrength.Elasticlimit,shownatpointBinFig.1,isthegreateststressthematerialcanwithstandwithoutanymeasurablepermanentstrainremainingafterthecompletereleaseofload.Withincreasingsensitiv-ityofstrainmeasurement,thevalueoftheelasticlimitisdecreaseduntilitequalsthetrueelasticlimitdeterminedfrommicrostrainmeas-urements.Withthesensitivityofstraintypicallyusedinengineeringstudies(10-4mm/mmorin./in.),theelasticlimitisgreaterthanthepro-portionallimit.Determinationoftheelasticlimitrequiresatediousincrementalloading-unloadingtestprocedure.Forthisreason,itisoftenreplacedbytheproportionallimit.Theyieldstrength,shownatpointYSinFig.1,isthestressrequiredtoproduceasmallspecifiedarnountofplasticdeformation.Theusualdefinitionofthispropertyistheoffsetyieldstrengthdeterminedbythestresscorrespondingtotheintersectionofthestress-straincurveoffsetbyaspecifiedstrain(seeFig.1).IntheUnitedStates,theoffsetisusu-allyspecifiedasastrainof0.2%or0.1%(e=0.002or0.001).Offsetyieldstrengthdeterminationrequiresaspecimenthathasbeenloadedtoits0.2%offsetyieldstrengthandunloadedsothatitis0.2%longerthanbeforethetest.TheoffsetyieldstrengthisreferredtoinISOStandardsastheproofstress(Rpo,1orRpo,2).IntheENstandardsformaterialsthatdonothaveayieldphenomenonpresent,the0,2%proofstrength(Rpo,2)or0,5%(Rpo,5)isdetermined.Thenonpropor-tionalelongationiseither0.1%,0.2%,or0.5%.Theyieldstrengthobtainedbyanoffsetmethodiscommonlyusedfordesignandspeci-ficationpurposes,becauseitavoidsthepracticaldifficultiesofmeasur-ingtheelasticlimitorproportionallimit.Somematerialshaveessentiallynolinearportiontotheirstress-straincurve,forexample,softcopperorgraycastiron.Forthesemate-rials,theoffsetmethodcannotbeused,andtheusualpracticeistodefinetheyieldstrengthasthestresstoproducesometotalstrain,forexample,e=0.005.TheEuropeanStandardforgeneral-purposecop-perrod,EN12163(Ref8),givesapproximate0,2%proofstrength(Rpo,2)forinformation,butitisnotarequirement.Thisapproachisfol-lowedforothermaterialforms(barandwire),butforsomecoppertubes,amaximumRpo,2isspecifiedForcopperalloypressurevesselplateandsomespringstrip,aminimumRpo,2isspecified.MaterialswithYieldPointPhenomenon.Manymetals,particu-larlyannealedlow-carbonsteel,showalocalized,heterogeneoustypeoftransitionfromelastictoplasticdeformationthatproducesayieldpointinthestress-straincurve.Ratherthanhavingaflowcurvewithagradualtransitionfromelastictoplasticbehavior,suchasFig.4(a),metalswithayieldpointproduceaflowcurveoraload-elongationdia-gramsimilartoFig.4(b).Theloadincreasessteadilywithelasticstrain,dropssuddenly,fluctuatesaboutsomeapproximatelyconstantvalueofload,andthenriseswithfurtherstrain.Fig.4t(I)in(d)u(e)ou(aliz)s(e)yiel(dpl)din(ots)g(o)wi(fs)t(t)h(r)ean(ss)-up(str)p(a)ie(n)r.(y(a)ip(n)to(i)nint(u)oA(u)san(y)d(ie)la(d)ire(ng)lat(c)iv(o)e(n)dly(i)tco(io)nn.s(t(b)a)nt(D)iy(s)cie(o)l--ingstressBtoCInENstandardsformaterialsexhibitingayieldpoint,theupperyieldstrength,ReHmaybespecified.Theupperandloweryieldstress(ReH₃ReL)arespecifiedinsomeENandISOstandardsinunitsofN/mm²(1N/mm²=1MPa).EN10027-1(Ref9)notestheterm“yieldstrength”asusedinthisEuropeanstandardreferstoupperorloweryieldstrength(ReHorReL),proofstrength(Rp),ortheproofstrengthtotalextension(R),dependingontherequirementspecifiedintherelevantproductstandard.Thisservesasacautionthatthedetailsonhowthe“yieldstrength”or“yieldpoint”isdefinedmustbeknownwhenmakinganycomparisonsorconclusionsastothematerialscharacteristics.Typicalyieldpointbehavioroflow-carbonsteelisshowninFig.5.Theslopeoftheinitiallinearportionofthestress-straincurve,desig-natedbyE,isthemodulusofelasticity.Theloadatwhichthesuddendropoccursiscalledtheupperyieldpoint.Theconstantloadiscalledtheloweryieldpoint,andtheelongationthatoccursatconstantloadiscalledtheyield-pointelongation.Thedeformationoccurringthrough-outtheyield-pointelongationisheterogeneous.Attheupperyieldpoint,adiscretebandofdeformedmetal,oftenreadilyvisible,appearsatastressconcentrationsuchasafillet.Coincidentwiththeformationoftheband,theloaddropstotheloweryieldpoint.Thebandthenpropagatesalongthelengthofthespecimen,causingtheyield-pointelongation.Fig.5Typicalyieldpointbehavioroflow-carbonsteelIntypicalcases,severalbandsformatseveralpointsofstresscon-centration.Thesebandsaregenerallyatapproximately45°totheten-sileaxis.TheyareusuallycalledLüdersbands,Hartmannlines,orstretcherstrains,andthistypeofdeformationissometimesreferredtoasthePioberteffect.Theyarevisibleandcanbeaestheticallyundesir-able.WhenseveralLüdersbandsareformed,theflowcurveduringtheyield-pointelongationisirregular,eachjogcorrespondingtothefor-mationofanewLüdersband.AftertheLüdersbandshavepropagatedtocovertheentirelengthofthespecimentestsection,theflowwillincreasewithstraininthetypicalmanner.Thismarkstheendoftheyield-pointelongation.ThetransitionfromundeformedtodeformedmaterialattheLüdersfrontcanbeseenatlowmagnificationinFig.6.TheroughsurfaceareasaretheLüdersbandsinthelow-carbonsteel.Thesebandsarealsoformedincertainaluminum-magnesiumalloys.NonlinearSegmentofContinuedDeformationStrainHardening.Thestressrequiredtoproducecontinuedplasticdeformationincreaseswithincreasingplasticstrain;thatis,themetalstrainhardens.Thevolumeofthespecimen(area×length)remainsconstantduringplasticdeformation,AL=A₀Lo,andasthespecimenelongates,itscross-sectionalareadecreasesuniformlyalongthegagelength.Initially,thestrainhardeningmorethancompensatesforthisdecreaseinarea,andtheengineeringstress(proportionaltoloadP)continuestorisewithincreasingstrain.Eventually,apointisreachedwherethedecreaseinspecimencross-sectionalareaisgreaterthantheincreaseindeformationloadarisingfromstrainhardening.Thiscondi-tionwillbereachedfirstatsomepointinthespecimenthatisslightlyweakerthantherest.Allfurtherplasticdeformationisconcentratedinthisregion,andthespecimenbeginstoneckorthindownlocally.Thestrainuptothispointhasbeenuniform,asindicatedonFig.1.Becausethecross-sectionalareaisnowdecreasingfarmorerapidlythantheabilitytoresistthedeformationbystrainhardening,theactualloadrequiredtodeformthespecimendecreasesandtheengineeringstressdefinedinEq1continuestodecreaseuntilfractureoccurs,atX.Thetensilestrength,orultimatetensilestrength,S,isthemax-imumloaddividedbytheoriginalcross-sectionalareaofthespecimen:Thetensilestrengthisthevaluemostfrequentlyquotedfromtheresultsofatensiontest.Actually,however,itisavalueoflittlefundamentalsignificancewithregardtothestrengthofametal.Forductilemetals,thetensilestrengthshouldberegardedasameasureofthemaximumloadthatametalcanwithstandundertheveryrestrictiveconditionsofuniaxialloading.Thisvaluebearslittlerelationtotheusefulstrengthofthemetalunderthemorecomplexconditionsofstressthatusuallyareencountered.Formanyyears,itwascustomarytobasethestrengthofstructuralmembersonthetensilestrength,suitablyreducedbyafactorofsafetyThecurrenttrendistothemorerationalapproachofbasingthestaticdesignofductilemetalsontheyieldstrength.However,becauseofthelongpracticeofusingthetensilestrengthtodescribethestrengthofmaterials,ithasbecomeafamiliarproperty,andassuch,itisausefulidentificationofamaterialinthesamesensethatthechemicalcompo-sitionservestoidentifyametaloralloy.Furthermore,becausetheten-silestrengthiseasytodetermineandisareproducibleproperty,itisusefulforthepurposesofspecificationandforqualitycontrolofaproduct.Extensiveempiricalcorrelationsbetweentensilestrengthandpropertiessuchashardnessandfatiguestrengthareoftenuseful.Forbrittlematerials,thetensilestrengthisavaliddesigncriterion.MeasuresofDuctility.Currently,ductilityisconsideredaqualita-tive,subjectivepropertyofamaterial.Ingeneral,measurementsofductilityareofinterestinthreerespects(Ref10):●Toindicatetheextenttowhichametalcanbedeformedwithoutfractureinmetalworkingoperationssuchasrollingandextrusion●Toindicatetothedesignertheabilityofthemetaltoflowplasticallybeforefracture.Ahighductilityindicatesthatthematerialis“for-giving”andlikelytodeformlocallywithoutfractureshouldthede-signererrinthestresscalculationorthepredictionofsevereloads.Toserveasanindicatorofchangesinimpuritylevelorprocessingconditions.Ductilitymeasurementsmaybespecifiedtoassessma-terialquality,eventhoughnodirectrelationshipexistsbetweentheductilitymeasurementandperformanceinservice.Theconventionalmeasuresofductilitythatareobtainedfromthetensiontestaretheengineeringstrainatfracture,es,(usuallycalledtheelongation)andthereductioninareaatfracture,q.Elongationandreductioninareausuallyareexpressedasapercentage.Bothofthesepropertiesareobtainedafterfracturebyputtingthespecimenbacktogetherandtakingmeasurementsofthefinallength,Lf,andfinalspec-imencrosssection,Af:Becauseanappreciablefractionoftheplasticdeformationwillbeconcentratedintheneckedregionofthetensionspecimen,thevalueofefwilldependonthegagelengthLooverwhichthemeasurementwastaken(seethesectionofthisarticleonductilitymeasurementintensiontesting).Thesmallerthegagelength,thegreaterthecontributiontotheoveralelongationfromtheneckedregionandthehigherthevalueofer.Therefore,whenreportingvaluesofpercentageelongation,thegagelength,Lo,shouldalwaysbegiven.Reductioninareadoesnotsufferfromthisdifficulty.Thesevaluescanbeconvertedintoanequivalentzero-gage-lengthelongation,eoFromtheconstancyofvolumerelationshipforplasticdeformation(AL=A₀Lo):更多内容见附件免责声明:本页面/内容部分素材来源于互联网公开信息,旨在传递更多信息,不代表本平台立场。版权归原作者或机构所有,如涉及侵权,请通过平台联系我们,我们将在核实后第一时间处理。本平台对转载内容的真实性、准确性不作任何保证,用户需自行判断并承担使用风险。
有附件
未登录
还没有评论
课程
培训
服务
行家
VIP会员 学习计划 福利任务
下载APP
联系我们
帮助与反馈