几百种材料的应力应变拉伸曲线图集_前半部分

Atlas of Stress-Strain C urves
Second Edition
Copyright ◎2002 by
AS M International®
All nights reserved
No part of this book may be reproduced,stored in a retrieval system,or trans mitted,in any form or by any means,electronic,
mechanical,photocopying,recording,or otherwise,without the written permission of the copyright owner.
First printing,December 2002
Great care is taken in the compilation and production of this book,but it should be made clear that NO WARRANTIES,
EXPRESS OR IMPLIED,INCLUDING,WITHOUT LIMITATION,WARRANTIES OF MERCHANTABILITY OR FITNESS FOR A PARTICULARPURPOSE,ARE GIVEN IN CONNECTION WITH THIS PUBLICATION.AIthough this information is believed to be accurate by AS M,AS M cannot guarantee that favorable results will be obtained from the use of this publication alone.This publi- cation is intended for use by persons having technical skill,at their sole discretion and risk.Since the conditions of product or material use are outside of AS M's control,AS M assumes no liability or obligation in connection with any use of this information.No claim of any kind,whether as to products or information in this publication,and whether or not based on negligence,shall be greater in amount than the purchase price of this product or publication in respect of which damages are claimed.THE REMEDY HEREBY PROVIDED SHALL BE THE EXCLUSIVE AND SOLE REMEDY OF BUYER,AND IN NO EVENT SHALL EITHER PARTY BE LIABLE FOR SPECIAL,INDIRECTOR CONSEQUENTIALDAMAGES WHETHER OR NOT CAUSED BYOR RESULTING FROM THE NEGLIGENCE OF SUCH PARTY.As with any material,evaluation of the material under end-use conditions prior to specification is essential.Therefore,specific testing under actual conditions is recommended.
Nothing contained in this book shall be construed as a grant of any right of manufacture,sale,use,or reproduction,in con-nection with any method,process,apparatus,product,composition,or system,whether or not covered by leters patent,copyright,or trademark,and nothing contained in this book shallbe construed as a defense against any alleged infringement of letters patent,copy- right,or trademark,or as a defense against liability for such infringement.
Comments,criticis ms,and suggestions are invited,and should be forwarded to AS M International.
Prepared under the direction of the AS M International Techrnical Book Committee (2001-2002),Charles A.Parker,Chair:
Prepared with assistance from the AS M International Materials Properties Database Committee,PJ.Sikorsky,Chair.
AS M International staff who worked on this project included Charles Moos brugger,Technical Editor;Veronica Flint, Acquisitions Editor;Bonnie Sanders,Manager ofProduction;Carol Terman,Production Project Manager;and Scot Henry,Assistant Director of Reference Publications.
Library of Congress Cataloging-in-Publication Data
Atlas of stress-strain curves.—2nd ed.
p.cm.
SAN:204-586—T.p.verso.
IS BN:0-87170-739-X
1.Stress-strain curves—Atlases.2.Metals—Testing.I.AS M International.
TA460.A862002
620.1'63—dc 21
2002027674
AS M International®
Materials Park,OH44073-0002
www.as minternationalorg
Printed in the United States of America
Contents
Preface ........................................................................................................................................ iv
Representation of Stress -Strain Behavior .................................................................. 1
Ferrous Metals .................................................................................................................... 21
Cast Iron (CI) ........................................................................................................................ 23
Carbon Steel (CS) .............................................................................................................. 67
Alloy Steel (AS) .................................................................................................................. 93
High -Strength Steel (HS) ............................................................................................. 129
Stainless Steel (SS) ......................................................................................................... 161
Tool Steel ( TS) ................................................................................................................... 269
Nonferrous Metals ......................................................................................................... 277
Cast Aluminum ( CA) ...................................................................................................... 279
Wrought Aluminum ( WA) ............................................................................................ 299
Aluminum Laminates (LA) ......................................................................................... 503
Copper (Cu) .......................................................................................................................... 515
Magnesium ( Mg) ............................................................................................................... 555
Nickel (Ni) ........................................................................................................................... 631
Reactive and Refractory Metals (RM) ................................................................ 705
Titanium ( Ti) ....................................................................................................................... 729
Pure Metals and Miscellaneous Alloys ( MA) ................................................ 799
Alloy Index .................................................................................................................. 809
UNS Index ........................................................................................................................ 815
Preface
In this information age,mechanical property data are plentiful.
However,locating needed information quickly,judging the validity of the data,and making reasoned comparisons of data can be daunting. Stress-strain curves condense much information about the mechanical behavior of metals into a convenient form.From these basic curves the engineer can extract such information as the strength,ductility,forma- bility,elasticity,and other information useful in predicting the per- formance of a particular alloy under stress.
AS M International published the first edition of the Atlas of Stress- Strain Curves,a collection of over 550 curves,in 1986.This book, along with the Atlas of Fatigue Curves,Atlas of Creep and Stress- Rupture Curves,and the Atlas of Stress-Corrosion and Corrosion Fatigue Curves,has formed a set of useful materials property resources for the engineer,materials scientist,and designer.
Well over three years ago—with the encouragement,assistance, and guidance of the AS M Technical Books and Materials Properties Database Committees—AS M International embarked on the project to create this updated,expanded,and improved Second Edition of the Atlas of Stress-Strain Curves.Some of the overriding goals of this project have been to:
● Add curves for materials that are especially useful to key industries, including aerospace,automotive,and heavy manufacturing
Seek out curves with a“pedigree”so readers can trace the source of the information and have some indication regarding its reliability
● Include as much pertinent information as possible for each curve. Factors such as heat-treat condition,product form,thickness,spec- imen size,orientation,history,testing temperature,and testing rate all affect materials performance and may be helpful when inter- preting the curves
● Normalize the presentation of the curves to facilitate comparisons among different materials
We feel AS M International has been reasonably successful in achieving these objectives in this editin.
Many people are involved in a project of this size,and we would like to thank those who have contributed to,or assisted,this effort First and foremost,AS MInternational thanks the materials researchers who created the original curves--without their efforts this volume would not exist.
Donna M.Walker,FAS M,Stressolvers Inc.,and Veronica Flint, AS M staff,initiated the project to revise and expand this book.AS M International thanks them for their efforts in helping to define the goals for this project and in acquiring many of the new curves to be added to the book.
Special thanks are extended to Special Metals,Gil Kaufman, FAS M,Kaufman Associates,and Buce Boardman,FAS M,Deere & Company,for their contributions of stress-strain curves.
Hiro Okamoto and his associates performed the huge task of redrawing the curves to normalize their presentation,and we are grate- ful for their accurate and timely work.
The organization and final quality of the data as seen in the book are my responsibility,and any errors,omissions,or misclassifications of alloys are mine.I thank Heather Lampman,the principal copy edi- tor,and the members of the AS M International production staff,who have worked diligently to keep any errors to a minimum.However,in any endeavor of this scope,there will be mistakes.Corrections,com- ments,and criticis ms are invited.
It should be noted that most of the data included in this book are not specified as being minimum,typical,or having any defined confi- dence level associated with them.The reader may want to refer to the source of a particular curve to find additional details.The "Introduction"in this book provides a review of the information that can be extracted from stress-strain curves,a clarification of terms used in describing mechanical behavior,and a guide to the limitations of the accuracy and precision of the information given.
Charles Moos brugger
Technical Editor
AS M International
Representation of Stress-Strain Behavior
Charles Moos brugger,AS M International
IT IS APPROPRIATE that a collection of stress-strain curves is named an atlas.An atlas is a collection of figures,charts,or maps,So named because early books pictured the Greek Titan,Atlas,on the cover or title page,straining with the weight of the world and heavens on his shoulders.This concept of visualizing the reaction to mechani- cal stress is central to development and use of stress-strain curves.
This introductory section provides a review of the fundamentals of the mechanical testing that is represented in the curves.The mathemat- ical interpretation of aspects of the curves will aid in an alysis of the curves.A list of terms common to stress-strain behavior is given at the end of this section.(Ref 1,2).
Tensile Testing
The simplest loading to visualize is a one-dimensional tensile test,in which a uniform slender test specimen is stretched along its long cen- tral axis.The stress-strain curve is a representation of the performance of the specimen as the applied load is increased monotonically usually to fracture.
Stress-strain curves are usually presented as:
●“Engineering”stress-strain curves,in which the original dimensions of the specimens are used in most calculations.
●"True"stress-strain curves,where the instantaneous dimensions of
the specimen at each point during the test are used in the calcula-
tions.This results in the “true”curves being above the “engineer-
ing”curves,notably in the higher strain portion of the curves.
The development of these curves is described in the following sec- tions.
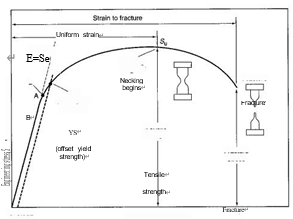
To document the tension test,an engineering stress-strain curve is constructed from the load-elongation measurements made on the test specimen(Fig.1).The engineering stress,S,plotted on this stress- strain curve is the average longitudinal stress in the tensile specimen.
It is obtained by dividing the load,P,by the original area of the cross sec- tion of the specimen,Ao:

The strain,e,plotted on the engineering stress-strain curve,is the aver- age linear strain,which is obtained by dividing the elongation of the gage length of the specimen,δ,by its original length,Lo:

Because both the stress and the strain are obtained by dividing the load and elongation by constant factors,the load-elongation curve has the same shape as the engineering stress-strain curve.The two curves fre- quently are used interchangeably.
The units of stress are force/length squared,and the strain is unitless.
The strain axis of curves traditionally are given units of in./in.or mm/mm rather than being listed as a pure number.Strain is sometimes expressed as a percent elongation.
The shape of the stress-strain curve and values assigned to the points on the stress-strain curve of a metal depend on its:
● Composition
● Heat treatment and conditioning
● Prior history of plastic deformation
● The strain rate of test
● Temperature
● Orientation of applied stress relative to the test specimens structure
● Size and shape
The parameters that are used to describe the stress-strain curve of a metal are the tensile strength,yield strength or yield point,ultimate ten- sile strength,percent elongation,and reduction in area.The first three are strength parameters;the last two indicate ductility.
The general shape of the engineering stress-strain curve(Fig.1) requires further explanation.This curve represents the full loading of a specimen from initial load to rupture.It is a “full-range”curve.Often engineering curves are truncated past the 0.2%yield point.This is the case of many of the curves in this Atlas.Other test data are presented as a “full-range”curve with an“expanded range”to detail the initial parts of the curve.
Linear Segment of Curves
From the origin,0,the initial straight-line portion is the elastic region,where stress is linearly proportional to strain.When the stress is removed,if the strain disappears,the specimen is considered com- pletely elastic.
The point at which the curve departs from the straight-line propor- tionality,A,is the proportional limit.
Modulus of elasticity,E,also known as Young's modulus,is the slope of this initial linear portion of the stress-strain curve:

where S is engineering stress and se is engineering strain.Modulus of elasticity is a measure of the stiffness of the material.The greater the modulus,the steeper the slope and the s maller the elastic strain result- ing from the application of a given stress.Because the modulus of elas- ticity is needed for computing deflections of beams and other structural members,it is an important design value.
The modulus of elasticity is determined by the binding forces between atoms.Because these forces cannot be changed without changing the basic nature of the material,the modulus of elasticity is one of the most structure-insensitive of the mechanical properties. Generally,it is only slightly affected by alloying additions,heat treat- ment,or cold work (Ref 3).However,increasing the temperature decreases the modulus of elasticity.At elevated temperatures,the mod- ulus is often measured by a dynamic method (Ref 4).Typical values of modulus of elasticity for common engineering materials are given in Table 1(Ref 5).
Resilience is the ability of a material to absorb energy when deformed elastically and to return it when unloaded.This property usu- ally is measured by the modulus of resilience,which is the strain energy per unit volume,Uo,required to stress the material from zero stress to the yield stress,Sx.The strain energy per unit volume for any point on the line is just the area under the curve:

From the definition of modulus of elasticity and the above definition, the maximum resilience occurs at the yield point and is called the mod- ulus of resilience,UR:

This equation indicates that the ideal material for resisting energy loads in applications where the material must not undergo permanent distor-
Table 1 Typical values for modulus of elasticity
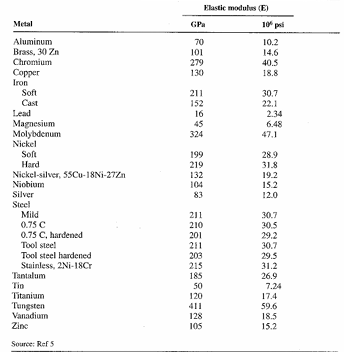
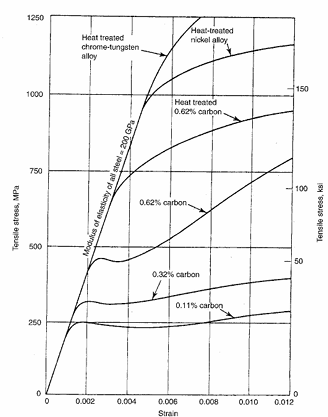
Fig.2 Stress-strain curves for selected steels.Source:Ref 7
tion,such as mechanical springs,is one having a high yield stress and a low modulus of elasticity.
For various grades of steel,the modulus of resilience ranges from 100 to 4500 kJ/m³(14.5 to 6501bf·in./in.³),with the higher values rep- resenting steels with higher carbon or alloy contents(Ref 6).This can be seen in Fig.2,where the modulus of resilience for the chromium- tungsten alloy would be the greatest of the steels,because it has the highest yield strength and similar modulus of elasticity.The modulus of resilience is represented as the triangular areas under the curves in Fig.3.
Figure 2 shows that while the modulus of elasticity is consistent for the given group of steels,the shapes of the curves past their propor- tionality limits are quite varied (Ref 7)
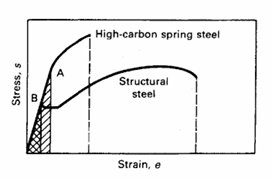
Fig.3 Comparison of stress-strain curves for a high-strength high-carbon spring
steel and a lower-strength structural steel.Point A is the elastic limit of the springsteel;point B is the elastic limit of the structural steel.The cross-hatched trian- gles are the modulus of resilience(UR).These two areas are the work done on the materials to elongate them or the restoring force within the materials.
Nonlinear Segment of Curves to Yielding
The elastic limit,B,on Fig.1,may coincide with the proportional- ity limit,or it may occur at some greater stress.The elastic limit is the maximum stress that can be applied without permanent deformation to the specimen.Some curves exhibit a definite yield point,while others do not.When the stress exceeds a value corresponding to the yield strength,the specimen undergoes gross plastic deformation.If the load is subsequently reduced to 0,the specimen will remain permanently deformed.
Measures of Yielding. The stress at which plastic deformation or yielding is observed to begin depends on the sensitivity of the strain measurements.With most materials,there is a gradual transition from elastic to plastic behavior,and the point at which plastic deformation begins is difficult to define with precision.In tests of materials under uniaxial loading,three criteria for the initiation of yielding have been used:the elastic limit,the proportional limit,and the yield strength.
Elastic limit,shown at point B in Fig.1,is the greatest stress the material can withstand without any measurable permanent strain remaining after the complete release of load.With increasing sensitiv- ity of strain measurement,the value of the elastic limit is decreased until it equals the true elastic limit determined from microstrain meas- urements.With the sensitivity of strain typically used in engineering studies(10-4mm/mm or in./in.),the elastic limit is greater than the pro- portional limit.Determination of the elastic limit requires a tedious incremental loading-unloading test procedure.For this reason,it is often replaced by the proportional limit.
The yield strength,shown at point YS in Fig.1,is the stress required to produce a s mall specified arnount of plastic deformation.The usual definition of this property is the offset yield strength determined by the stress corresponding to the intersection of the stress-strain curve offset by a specified strain(see Fig.1).In the United States,the offset is usu- ally specified as a strain of 0.2%or 0.1%(e=0.002 or 0.001).
Offset yield strength determination requires a specimen that has been loaded to its 0.2%offset yield strength and unloaded so that it is 0.2% longer than before the test.The offset yield strength is referred to in ISO Standards as the proof stress(Rpo,1 or Rpo,2).In the EN standards for materials that do not have a yield phenomenon present,the 0,2% proof strength(Rpo,2)or 0,5%(Rpo,5)is determined.The nonpropor- tional elongation is either 0.1%,0.2%,or 0.5%.The yield strength obtained by an offset method is commonly used for design and speci- fication purposes,because it avoids the practical difficulties of measur- ing the elastic limit or proportional limit.
Some materials have essentially no linear portion to their stress- strain curve,for example,soft copper or gray cast iron.For these mate- rials,the offset method cannot be used,and the usual practice is to define the yield strength as the stress to produce some total strain,for example,e=0.005.The European Standard for general-purpose cop- per rod,EN 12163(Ref 8),gives approximate 0,2%proof strength (Rpo,2)for information,but it is not a requirement.This approach is fol- lowed for other material forms(bar and wire),but for some copper tubes,a maximum Rpo,2 is specified For copper alloy pressure vessel plate and some spring strip,a minimum Rpo,2 is specified.
Materials with Yield Point Phenomenon.Many metals,particu- larly annealed low-carbon steel,show a localized,heterogeneous type of transition from elastic to plastic deformation that produces a yield point in the stress-strain curve.Rather than having a flow curve with a gradual transition from elastic to plastic behavior,such as Fig.4(a), metals with a yield point produce a flow curve or a load-elongation dia- gram similar to Fig.4(b).The load increases steadily with elastic strain, drops suddenly,fluctuates about some approximately constant value of load,and then rises with further strain.
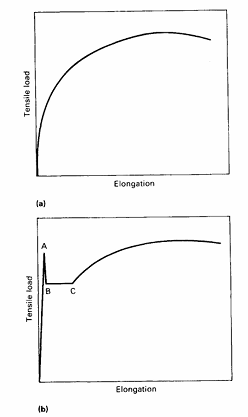
Fig.4 t(I)in(d)u(e)ou(aliz)s(e)yiel(d pl)din(ots)g(o)wi(f s)t(t)h(r)ean(ss)- up(str)p(a)ie(n)r.(y(a)i p(n)to(i)nint(u)oA(u)san(y)d(ie)la(d)ire(ng)lat(c)iv(o)e(n)dly(i)tco(io)nn.s(t(b)a)nt(D)iy(s)cie(o)l --
ing stress B to C
In EN standards for materials exhibiting a yield point,the upper yield strength,ReH may be specified.The upper and lower yield stress(ReH₃ ReL)are specified in some EN and ISO standards in units of N/mm² (1N/mm²=1MPa).EN 10027-1(Ref9)notes the term “yield strength”
as used in this European standard refers to upper or lower yield strength (ReH or ReL),proof strength(Rp),or the proof strength total extension (R),depending on the requirement specified in the relevant product standard.This serves as a caution that the details on how the “yield strength”or “yield point”is defined must be known when making any comparisons or conclusions as to the materials characteristics.
Typical yield point behavior of low-carbon steel is shown in Fig.5.
The slope of the initial linear portion of the stress-strain curve,desig- nated by E,is the modulus of elasticity.The load at which the sudden drop occurs is called the upper yield point.The constant load is called the lower yield point,and the elongation that occurs at constant load is called the yield-point elongation.The deformation occurring through- out the yield-point elongation is heterogeneous.At the upper yield point,a discrete band of deformed metal,often readily visible,appears at a stress concentration such as a fillet.Coincident with the formation of the band,the load drops to the lower yield point.The band then propagates along the length of the specimen,causing the yield-point elongation.
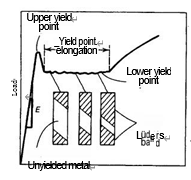
Fig.5 Typical yield point behavior of low-carbon steel
In typical cases,several bands form at several points of stress con- centration.These bands are generally at approximately 45°to the ten-sile axis.They are usually called Lüders bands,Hartmann lines,or stretcher strains,and this type of deformation is sometimes referred to as the Piobert effect.They are visible and can be aesthetically undesir- able.When several Lüders bands are formed,the flow curve during the yield-point elongation is irregular,each jog corresponding to the for- mation of a new Lüders band.After the Lüders bands have propagated to cover the entire length of the specimen test section,the flow will increase with strain in the typical manner.This marks the end of the yield-point elongation.The transition from undeformed to deformed material at the Lüders front can be seen at low magnification in Fig.6. The rough surface areas are the Lüders bands in the low-carbon steel. These bands are also formed in certain aluminum-magnesium alloys.
Nonlinear Segment of Continued Deformation
Strain Hardening.The stress required to produce continued plastic deformation increases with increasing plastic strain;that is,the metal strain hardens.The volume of the specimen(area ×length)remains constant during plastic deformation,AL=A₀Lo,and as the specimen elongates,its cross-sectional area decreases uniformly along the gage length.
Initially,the strain hardening more than compensates for this decrease in area,and the engineering stress(proportional to load P) continues to rise with increasing strain.Eventually,a point is reached where the decrease in specimen cross-sectional area is greater than the increase in deformation load arising from strain hardening.This condi- tion will be reached first at some point in the specimen that is slightly weaker than the rest.All further plastic deformation is concentrated in 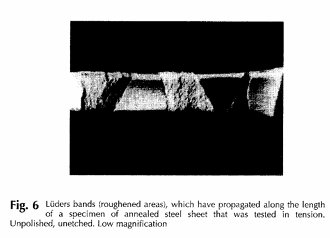
this region,and the specimen begins to neck or thin down locally.The strain up to this point has been uniform,as indicated on Fig.1.Because the cross-sectional area is now decreasing far more rapidly than the ability to resist the deformation by strain hardening,the actual load required to deform the specimen decreases and the engineering stress defined in Eq 1 continues to decrease until fracture occurs,at X.
The tensile strength,or ultimate tensile strength,S,is the max-imum load divided by the original cross-sectional area of the specimen:

The tensile strength is the value most frequently quoted from the results of a tension test.Actually,however,it is a value of little fundamental significance with regard to the strength of a metal.For ductile metals, the tensile strength should be regarded as a measure of the maximum load that a metal can withstand under the very restrictive conditions of uniaxial loading.This value bears little relation to the useful strength of the metal under the more complex conditions of stress that usually are encountered.
For many years,it was customary to base the strength of structural members on the tensile strength,suitably reduced by a factor of safety The current trend is to the more rational approach of basing the static design of ductile metals on the yield strength.However,because of the long practice of using the tensile strength to describe the strength of materials,it has become a familiar property,and as such,it is a useful identification of a material in the same sense that the chemical compo- sition serves to identify a metal or alloy.Furthermore,because the ten- sile strength is easy to determine and is a reproducible property,it is useful for the purposes of specification and for quality control of a product.Extensive empirical correlations between tensile strength and properties such as hardness and fatigue strength are often useful.For brittle materials,the tensile strength is a valid design criterion.
Measures of Ductility.Currently,ductility is considered a qualita- tive,subjective property of a material.In general,measurements of ductility are of interest in three respects(Ref 10):
● To indicate the extent to which a metal can be deformed without fracture in metalworking operations such as rolling and extrusion
● To indicate to the designer the ability of the metal to flow plastically before fracture.A high ductility indicates that the material is“for- giving”and likely to deform locally without fracture should the de- signer err in the stress calculation or the prediction of severe loads. To serve as an indicator of changes in impurity level or processing conditions.Ductility measurements may be specified to assess ma- terial quality,even though no direct relationship exists between the ductility measurement and performance in service.
The conventional measures of ductility that are obtained from the tension test are the engineering strain at fracture,es,(usually called the elongation)and the reduction in area at fracture,q.Elongation and reduction in area usually are expressed as a percentage.Both of these properties are obtained after fracture by putting the specimen back together and taking measurements ofthe final length,Lf,and final spec- imen cross section,Af:
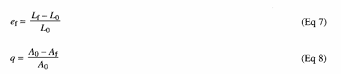
Because an appreciable fraction of the plastic deformation will be concentrated in the necked region of the tension specimen,the value of ef will depend on the gage length Lo over which the measurement was taken(see the section of this article on ductility measurement in tension testing).The s maller the gage length,the greater the contribution to the overal elongation from the necked region and the higher the value of er.Therefore,when reporting values of percentage elongation,the gage length,Lo,should always be given.
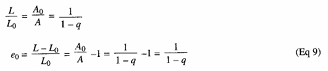
Reduction in area does not suffer from this difficulty.These values can be converted into an equivalent zero-gage-length elongation,eo From the constancy of volume relationship for plastic deformation (AL=A₀Lo):
更多内容见附件
免责声明:
本页面/内容部分素材来源于互联网公 开 信 息,旨在传递更多信息,不代表本平台立场。
版权归原作者或机构所有,如涉及侵权,请通过平台联系我们,我们将在核实后第一时间处理。
本平台对转载内容的真实性、准确性不作任何保证,用户需自行判断并承担使用风险。