甲醇双级火焰的实验与数值模拟研究(EXPERIMENTAL AND NUMERICAL STUDIES OF TWO-STAGE METHANOL FLAMES)摘要:本文采用实验与数值模拟结合,研究当量比 1.6–3.0、应变率 50–100 s⁻¹ 下甲醇对冲双级火焰结构。实验测量温度与稳定组分分布,模拟采用 28 组分、92 步详细机理。原版机理显著高估 CH₄与 C₂浓度并偏移预混火焰位置;通过引入 H 进攻甲醇的温度依赖分支比,增加 CH₃O 异构化反应,实现与实验高度吻合。揭示甲醇主要经 H 与 OH 夺氢生成 CH₂OH 与 CH₃O,再转化为 CH₂O、CO 最终氧化。研究明确关键基元反应速率,为甲醇双级燃烧与 NOₓ生成模拟提供可靠机理与反应路径。A laminar counterflow configuration is investigated in which a fuel-rich methanol spray is transported by air against an opposing air stream. The fuel-stream equivalence ratio ranges from 1.6 to 3.0, and the fuel-side strain rate from 50 s__ 1 to 100 s__ 1. Under these conditions, there is a vaporization plane in the fuel stream at which the spray disappears, a pale green fuel-rich premixed flame in the fuel stream, and a brighter blue diffusion flame in the vicinity of the stagnation plane. Temperature profiles are measured by thermocouples, and concentration profiles of stable species are measured by gas chromatography of sam- ples withdrawn by a fine probe. Computational methods are employed to calculate the flame structure, with detailed chemistry and transport included. Chemical-kinetic descriptions available in the literature predict the premixed flame to be more than 0.5 mm closer to the diffusion flame than observed experi- mentally and give nearly twice the measured peak CH4 concentration and more than twice the measured concentration of C2H2 in the premixed flame. Modification of the rate data by introducing a temperature- dependent branching ratio to the isomers CH3O and CH2OH, in the H attack on CH3OH, patterned after the known variation in the OH attack and by including the step CH3O + M → CH2OH + M, produces good agreement between all experimental and computational results. A reaction path for methanol in these flames is suggested, including routes to CH, important for prompt NO formation.IntroductionDetailed measurements for premixed-flamestruc- tures of fuel-rich methanol sprays are not available in the literature. Since those measurements and their comparison with theory may significantly im- prove our understanding of methanol flame chem- istry, an experimental and computational study of a two-stage methanol-air flame is performed here to investigate how methanol is oxidized in rich pre- mixed and diffusion flames. Staged combustion can be realized in a counterflow burner where, for in- stance, a fuel-rich mixture flows upward counter to a stream of pure air. A practical motivation for study- ing this configuration arises from its possible utility in increasing combustion stability and combustion efficiency and in reducing pollutants. A test rig can be constructed that affords ready access for instru- mentation, and complementary theoretical and com- putational studies are facilitated by reduction of the applicable conservation equations along the center- line to ordinary differential equations.Yamaoka and Tsuji [1–3] performed experiments to study the structures of two-stage flames of rich mixtures of methane and air in the forward stagna- tion region of a porous cylinder. Seshadri and co- workers [4–6] investigated the structure and extinc- tion of partially premixed counterflow flames.Nishioka, Nakagawa, Ishikawa, and Takeno [7] nu- merically studied NO emission characteristics in the two-stage flame of methane-air, based on the exper- iments of Yamaoka and Tsuji. Li, Ilincic, and Wil- liams [8] experimentally and numerically studied in- fluences of water sprays and partial premixing of air into fuel on the flame structures and pollutant for- mation in staged combustion of methane and air in an axisymmetric counterflow burner. These previous studies are most closely related to the present work; there are many other investigations of counterflow spray combustion and counterflow gaseous fuel com- bustion that do not involve partial premixing. The focus of the present paper concerns details of the flame chemistry in staged methanol combustion. The goal is to identify a reliable chemical reaction mechanis m for methanol combustion in both pre- mixed and diffusion flames, so that a systematic re- duced mechanis m can be established and can be used to predict combustion behavior in practical combustors. This research can be extended to other liquid fuel combustion.ExperimentBurner and FlameThis study employed a two-phase laminar coun- terflow burner described previously [9]. In this burner, coaxial streams issue from two ducts placed one above the other, each with exit radius of 22.5 mm. The separation distance between the duct exits is L = 18 mm. A solid-cone pressure atomizer is installed at the bottom of the lower duct, whose walls are heated by heating tapes, with feedback control of energy input so that the gas temperature at the exit of the spray duct, measured by thermocouple, is 310 K. This temperature is selected in the present experiment to have a well-controlled equivalence ra- tio above 1.6. Liquid methanol (Class 1B, Fisher) is fed into the atomizer from a tank pressurized to 0.68 MPa, so that a dispersed spray is produced in the duct. To have a two-stage flame as shown in Fig. 1a, the air stream flows through the upper duct, and the methanol spray is carried by an oxygen-nitrogen mix- ture in the lower duct. This oxygen-nitrogen ratio is the same as air for the specific experimental condi- tion an alyzed in detail here, but in general, is some- what greater or somewhat less than air, depending on flow conditions, for forming clearly defined two- stage flames.The mass flow rate mF of methanol is a function only of m__ , the sum of mO2, the mass flow rate of m__ was described earlier [9]. Given the flow rates of methanol and oxygen, the equivalence ratio of the premixed flame is calculated as Φ = 1.5 mF/mO2 .FiG. 1. (a) Schematic diagram of a two-stage flame of a methanol spray in counterflowing streams. (b) A photo- graph of the flame sketched in (a).The fuel-side strain rate a is determined by both m__ and m + , the mass flow rate of the air stream in the upper duct. The three experimentally adjustable pa- rameters are m + , mO2 and mN2, measured by three mass flow meters. The ratio m + /m__ is kept approx- imately constant to position the two-stage flame around the midplane between the duct exits, while the ratio mO2/mN2 adjusts Φ, and the sum m ,+ m__ adjusts a.In the experiment, the desired equivalence ratio and strain rate are established first, and then a torch is used to ignite the flame, which may last several hours for the experimental measurements. A typical photograph of such a flame is shown in Fig. 1b. It can be seen that there are two distinguished flame zones: one is thin with pale green emission, and the other is thicker and brighter. The former is the pre- mixed flame where the methanol is consumed to form carbon monoxide and hydrogen along with some carbon dioxide and water, and the latter is the diffusion flame where the CO and H2 produced in the first stage burn. Between these two flames, violet emissions, which become reddish if s mall percent- ages of water are added to the methanol, are clearly detectable visually in a darkened room. It seems likely that the color of the premixed flame is domi- nated by emissions from C2 species, while that of the diffusion flame reflects excited CO2 emissions stem- ming from the oxidation of CO. These flame colors are quite similar to those of two-stage methane-air flames [8].Experimental DiagnosticsThe measurement techniques used in the present study are essentially the same as described previ- ously [8– 10]. A Varian 3600 gas chromatograph, which has molecular sieve and porapak Q columns with a thermal conductivity detector, is employed to measure concentrations of stable species. Gas sam- ples in the flame are taken by a quartz microprobe whose tip has a outer diameter of 0.5 mm and an inner diameter of 0.1 mm. In the present study, spe- cies in the flame measured by the gas chromato- graph are H2, O2, N2, CH4, CO, CO2, CH3OH, and C2 species, and the sum of C2H2, C2H4, and C2H6, calculated to be mostly C2H2. Temperature profiles are measured with a Pt–6% Rh vs. Pt–30% Rh ther- mocouple with a bead diameter of 140 μm; correc- tions for radiation are made. Velocity fields and spray structures are measured by a two-component fiber- optical phase-doppler particle an alyzer (PDPA) [10]. The gas-sampling probe tip, the thermocouple bead, and the probe volume formed by the laser beams of the PDPA are positioned at the desired centerline point by moving the burner assembly axially and ra- dially. The measurements provide velocity profiles in the spray stream, the position of the premixed flame (relevant to the burning velocity), profiles of temperature, profiles of major stable species, and profiles of minor stable species (such as CH4 and the “C2 species” defined above).Numerical ComputationsThe numerical integrations concern laminar flames with potential flow in the outer streams. Ra- diation from CO, CO2, and H2O is taken into ac- count in the energy equation. Single-phase flow was assumed, with methanol vaporization accounted for only in energy conservation. This was deemed suf- ficient because experimentally, the vaporization plane is at a temperature around 350 K, well below the premixed flame. As a consequence of extensive prevaporization in the heated fuel duct, the vapori- zation correction is not large; if vaporization is ne- glected, then the computed maximum flame tem- perature is 80 K higher at most. With these assumptions, the equations of continuity, radial mo- mentum, energy, and chemical species reduce to those given previously [5,6]. The present computa- tions employ a numerical code developed at RWTH, Aachen, Germany [11].The Chemical Reaction Mechanis mThe present study employs a detailed chemical mechanis m consisting of 92 elementary reactions among 28 species, which are CH3OH, O2, CO, CO2, H2, H2O, H, OH, O, CH3O, CH2OH, CH3, CH4, C2H2, C2H4, C2H6, CH, 1CH2, 3CH2, CHO, CH2O, CHCO, C2H, C2H3, C2H5, HO2, H2O2, and N2. The rate parameters for the elementary steps, taken mainly from the volume of Peters and Rogg [12] (reactions 1–24, 29–47, 49–61, 83–86, 88, 90), are listed in Table 1. Some additional reactions, such as the H attack on CH2OH to form CH3 [13] and re- actions related to 1CH2, 3CH2, CH, and CH3O [14], also are included. Except as discussed below, most of these rate parameters have been tested in various hydrocarbon flames and rest on relatively firm ground; under present conditions, for example, they give rates that differ negligibly from those employed earlier [15] for methanol diffusion flames. The early fuel-consumption steps, however, need further con- sideration if good agreement with experiment is to be achieved for the structure of the premixed flame.In these flames, CH3OH is attacked mainly by H and OH radicals to form CH2OH and its isomer CH3O, according toCH3OH + OH → CH2OH + H2O (1)CH3OH + OH → CH3O + H2O (2)CH3OH + H → CH2OH + H2 (3)CH3OH + H → CH3O + H2 (4)Since these two isomers tend to travel different paths, CH3O giving CH3 and therefore CH4 and C2 species more easily, it is important to determine the branching ratios k1/k2 and k3/k4 accurately. While earlier work [13,16] adopted constant branching ra- tios, there is clear evidence for an increase in CH3O yield with increasing temperature in the OH attack. A recent reevaluation [14] of steps 1 and 2 took this into account, producing improved results that are compared with earlier values in Table 2, where rate differences on the order of a factor of 5 are seen. However, that evaluation did not introduce corre- spondingly variable branching for the H attack in steps 3 and 4. The H attack is of greater importance in methanol flames, and although less information is available for this than for OH, there is every reason to believe that the branching will vary comparably [15]. Therefore, in the present work, GRI-mech [14] is accepted for steps 1 and 2 but modified for steps 3 and 4 to maintain the same total CH3OH con- sumption rate and the same room-temperature branching, while introducing variable branching giv- ing crossover at 800 K, the same as the crossover temperature for OH attack. The revised rate con- stants, shown in Table 2, are designed to be used between 300 K and 2500 K.Although CH3O can produce formaldehyde byCH3O + M → CH2O + H + M (5)possible competition to this step is provided byCH3O + M → CH2OH + M (6)which was found previously [15] to be helpful in achieving good predictions of methanol diffusion- flame extinction through reduced chemistry. In the present work, rate parameters for these two steps are taken from a relatively recent compilation [17]. Further work is needed in making predictions with even more recent rate parameters [18] which differ from the present ones for steps 3, 4, 5, and 6, and in comparing the results with those obtained here.The Reaction PathwaysFigure 2 shows the reaction path for Φ = 2, fuel- stream temperature 310 K, air-stream temperature 298 K, and a = 50 s__ 1, at normal atmospheric pres- sure. While specific information in the figure is as- sociated with this condition, the general scheme ap- plies over a wide range of conditions for which two-stage flames exist. In this figure, the heavier ar- rows represent the main pathways, with the agents and their fractions given in light print. The fractions (in parentheses) are obtained by integrating con- sumption rates over the entire field, including both flames.It is seen here that 34% and 50% of the methanol is consumed by reactions 3 and 4, respectively, while only 5% and 9% is consumed reactions 1 and 2, re- both CH2OH and CH3O. Although CH3O gives spectively. Clearly, H plays the most important role, CH3 more readily than does CH2OH, the reverse with branching to CH3O being dominant. Most of paths are significant, so that the predicted CH3 con- the CH3O goes to its isomer CH2OH, which even- centrations are quite sensitive to all of these various tually is oxidized mainly to CO2 through CH2O, rate constants. Because most of the CH3O and CHO, and CO. However, some CH3 is formed from CH2OH go to CH2O, the amount of CH3 producedFiG. 2. Reaction path of methanol for Φ = 2.is very low; numerical computations show that its typical maximum concentration is around 500 ppm compared with 3000 ppm in corresponding two- stage methane flames. As a consequence, formation rates of C2 species are very s mall; the typical maxi- mum concentrations of C2H2, C2H4, and C2H6 are around 200 ppm, 60 ppm, and 40 ppm, respectively, in these methanol flames, compared with 5000 ppm, 2000 ppm, and 1500 ppm, respectively, in corre- sponding methane flames. These results are consis- tent with the very low sooting tendencies of meth- anol. With the lower CH3 concentration, the maximum concentration of CH in the methanol flames is much lower than that in the methane flames, and therefore the prompt NOx formation in the methanol flames is calculated to be significantly s maller.FiG. 3. Profiles of axial velocity, number density, and Sauter mean diameter on the burner axis.Comparison between Experiment and ComputationDroplet Velocity and Spray StructureThe conditions selected here for detailed compar- isons have m + = 0.470 g/s and m__ = 0.493 g/s and are selected to give Φ = 2 and a = 50 _ 1. Results of spray measurements are shown in Fig. 3, where W is the axial component of velocity, n the number density per cubic millimeter, and D32 the SauterFiG. 4. Comparisons between measurement and com- putation for concentration profiles of CH3OH, CO, CO2, H2, N2, and O2, for Φ = 2, a = 50 _ 1.FiG. 5. Comparisons between measurement and com- putation for profiles of temperature and of concentrations of CH4 and of C2 species, and the computed profiles of H and OH, for Φ = 2, a = 50 _ 1.mean diameter in microns. The solid curve is the result of the numerical computations; the measure- ments cover only that s mall portion of the curve where the spray exists. The value of the potential- flow strain rate a in the computation is selected to produce the excellent agreement of the velocity pro- file seen in Fig. 3. The rapid decrease in number density in approaching the vaporization plane is a consequence of droplet vaporization. The corre- sponding s mall increase in Sauter mean diameter re- sults from the same effect, as well as cross-stream- line migration of a few of the larger droplets. These results are based on about 4000 PDPA samples. Be- cause of the relatively high temperature at which the fuel-duct walls are kept in these experiments, the liquid fuel flux is only about 20% of the total fuel flux, and the influence of the spray is s mall.Flame StructureThe computational results reported here apply, as boundary conditions on mass fractions and temper- ature, YCH3OH = 0.237, YO2 = 0.178, YN2 = 0.585, Yi = 0 otherwise, and T = 310 K at z = _Ls, and YO2 = 0.233, YN2 = 0.767, Yi = 0 otherwise, and T = 298 K at z = Ls in Fig. 1. The computations exhibit a hot diffusion flame near z = 2 mm and a cooler premixed flame near z = _3 mm, as seen in Fig. 4. These temperature variations affect the ve- locity profiles in Fig. 3, where velocity extrema are found at each flame. Excellent agreement with ex- periment is seen in Fig. 4 concerning concentration profiles of N2, O2, CH3OH, CO2, CO, and H2. In particular, the location of the premixed flame (re- lated to its burning velocity) is predicted well, as seen from the agreement of the locations ofthe peak CO and H2 concentrations.Figure 5 compares the remaining experimental re- sults with computational predictions; here XC2 de-notes the sum of the mole fraction of C2H6, C2H4, and C2H2. In this figure, two different sets of com- putational results are shown: for the solid curves, the chemistry is the same as for all other figures, while for the dashed curves step 6 has been removed from the system. This removal is seen in Fig. 5 to displace the premixed flame appreciably and to increases the peak concentrations of methane and the C2 species. Aside from these changes, there is little influence on other profiles, including those of radical concentra- tions. Figure 5 clearly demonstrates the importance of including step 6 to achieve agreement with the present experiment. Theoretical and experimental temperature profiles, as well as species profiles, then agree, within the accuracies of the measurements. Figure 5 also demonstrates the enhanced impor- tance of the H atom in the premixed flame; its con- centration is much greater than that of OH there, while the OH concentration is larger in the diffusion flame.A magnified view of the computed structure of the premixed flame is shown in Fig. 6. With the rate data employed, the CH3O, although important (see Fig. 2), nevertheless reaches only about 20% of the CH2OH concentration because of step 6; both of these initial fuel-decomposition products peak at the same location. Formaldehyde is formed early in the flame, mainly from CH2OH, and its concentration peaks early because of its consumption in the later part of the premixed reaction zone. By contrast, CH3, and especially CH, are formed later, nearer to the location at which the H concentration first peaks. Prompt NOx thus would be produced mainly in the downstream part of this premixed flame.Concluding RemarksBesides their potential practical interest, two-stage flames of the kind studied here afford advantages for determining flame chemistry, providing a greater range of reaction-zone conditions and larger dis- tances for easier spatial resolution, thereby aiding in obtaining reliable experimental results. In identify- ing rate parameters for numerical computations to compare with the present experiments, the currently compiled elementary rate data for reactions CH3OH + H → CH2OH + H2 and CH3OH + H → CH3O + H2 have been modified here; it was reasoned that the rate ratio of the former to the latter, 0.43 exp(674/T), should be temperature dependent. These results may contribute to providing useful el- ementary rates for combustion in methanol flames, but more work is needed, comparing predictions ob- tained with different selections of rate constants, be- fore definitive conclusions can be drawn.FiG. 6. Computed profiles of temperature and concen- trations of CH, CH3, CH2O, CH3O, CH2OH, H, CH3OH, and O2 in the premixed flame, for Φ = 2, a = 50 _ 1.AcknowledgmentWe are indebted to R. X. Zang and to W. Willemse for helping with the experimental measurements. We also wish to thank K. Sheshadri, A. Grudno, and N. Ilincic for helpful discussions and suggestions in the course of this work, and F. L. Dryer for providing a prepublication copy of his pa- per. This research was supported by the Department of Energy, Office of Basic Energy Sciences, Division of En- gineering and Geosciences under Contract DE-F003- 87ER13685.REFERENCES1. Yamaoka, I., and Tsuji, H., Fifteenth Symposium (In- ternational) on Combustion, The Combustion Insti- tute, Pitts burgh, 1975, pp. 637–644.2. Yamaoka, I., and Tsuji, H., Sixteenth Symposium (In- ternational) on Combustion, The Combustion Insti- tute, Pitts burgh, 1977, pp. 1145–1154.3. Yamaoka, I., and Tsuji, H., Seventeenth Symposium (International) on Combustion, The Combustion In- stitute, Pitts burgh, 1979, pp. 843–855.4. Seshadri, K., Puri, I. K., and Peters, N., Combust. Flame 61:237–249 (1985).5. S mooke, M. D., Seshadri, K., and Puri, I. K., Twenty- Second Symposium (International) on Combustion, The Combustion Institute, Pitts burgh, 1988, pp. 1555– 1563.6. S mooke, M. D., Crump, J., Seshadri, K., and Giovan- gigli, V., Twenty-Third Symposium (International) on Combustion, The Combustion Institute, Pitts burgh, 1990, pp. 463–470.7. Nishioka, M., Nakagawa, S., Ishikawa, Y., and Takeno, T., Combust. Flame 98:127–138 (1994).8. Li, S. C., Ilincic, N., and Williams, F. A., “Reduction of NOx formation by water sprays in strained two-stage flames,” AS MEJ. Eng. Gas Turbines Power submitted, October, 1995.9. Li, S. C., Libby, P. A., and Williams, F. A. Twenty- Fourth Symposium (International) on Combustion, The Combustion Institute, Pitts burgh, 1992, pp. 1503– 1512.10. Li, S. C., Libby, P. A., and Williams, F. A., Combust. Flame 94:161–177 (1993).11. Pitsch, H., Master’s Thesis, RWTH Aachen, Germany, 1993.12. Peters, N., in Reduced Kinetic Mechanis ms for Appli- cations in Combustion Systems (N. Peters and B. Rogg, Eds.), Spinger-Verlag, Berlin, 1993, pp. 3–13.13. Egolfopoulos, F. N., Du, D. X., and Law, C. K., Com- bust. Sci. Technol. 86:253–265 (1992).14. GRI-mech Version 2.1, released 9/6/1995, CHEM- KIN-II format (//www.gri.org).15. Zhang, B. L., Card, J. M., and Williams, F. A., “Appli- cation of Rate-Ratio Asymptotics to the Prediction of Extinction for Methanol Droplet Combustion,” Com- bust. Flame, 105:267–290 (1996).16. Driver, H. S. T., Hutcheon, R. J., Lockett, R. D., Rob- ertson, Grotheer, H.-H., and Klem, S., Ber. Bunsenges. Phys. Chem. 96:1376–1387 (1992).17. Peters, N., Turbulente Brenngeschwindigkeit, Abschlußbericht zum DFG Forschungsvorhaben Pe 241/9-2, RWTH Aachen, Instut fr Technische Mechanik, D-52056 Aachen, Germany, August 1994.18. Held, T. J., and Dryer, F. L., “A Comprehensive Mech- anis m for Methanol Oxidation,” Int. J. Chem. Kin. 1996, submitted.免责声明:本页面/内容部分素材来源于互联网公 开 信 息,旨在传递更多信息,不代表本平台立场。版权归原作者或机构所有,如涉及侵权,请通过平台联系我们,我们将在核实后第一时间处理。本平台对转载内容的真实性、准确性不作任何保证,用户需自行判断并承担使用风险。


 .
. and double-click the scene node
  to open the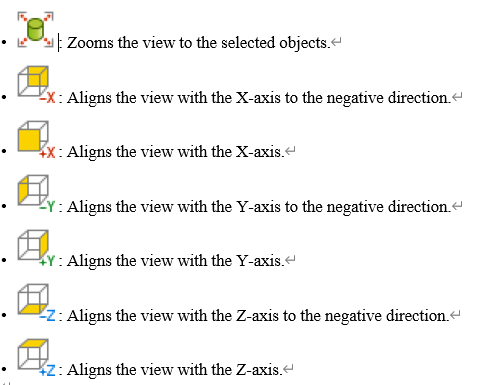
 .
. .
.
 .
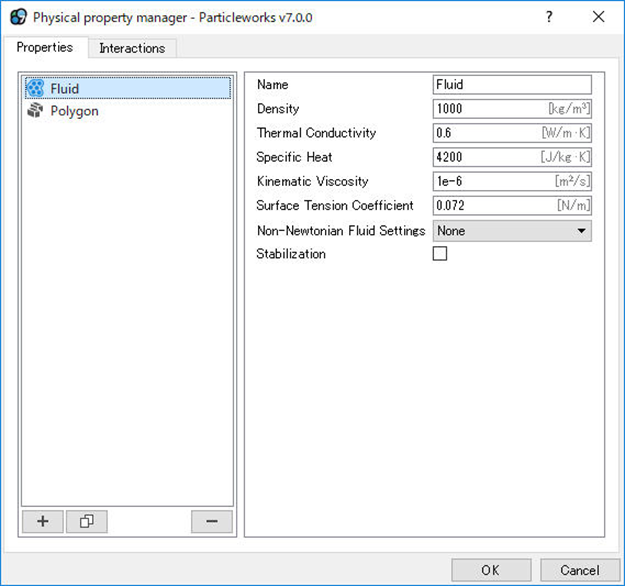
.
 to move on to the next setting step.