
烃类对 NO-NO₂转化促进作用的实验与动力学研究

烃类对 NO-NO₂转化促进作用的实验与动力学研究(NOx,CH4,C2H4,C2H6,C3H6,C3H8)
摘要:
本文通过流动反应器实验与详细化学动力学模拟,研究甲烷、乙烯、乙烷、丙烯、丙烷五种 C₁–C₃碳氢化合物对 NO→NO₂转化的促进作用。实验在 600–1100 K、常压下开展,动力学模型包含 639 个基元反应与 126 种组分。结果表明,乙烯与丙烷对 NO 氧化效果最强,甲烷最弱;转化仅在低温区间(650–1000 K)显著,高温下 NO₂会被还原。NO→NO₂主要通过 NO+HO₂=NO₂+OH 进行,碳氢化合物通过生成 OH 与 HO₂自由基促进转化,甲基、烯丙基等难氧化自由基会还原 NO₂。模型较好复现了燃料种类与温度的影响规律,揭示了低温氧化与 NOₓ转化的耦合机制。
AN EXPERIMENTAL AND KINETIC CALCULATION OF THE PROMOTION
EFFECT OF HYDROCARBONS ON THE NO–NO2 CONVERSION
IN A FLOW REACTOR
MORIO HORI,1 NAOKI MATSUNAGA,1 NICK MARINOV,2 WILLIAM PITZ2 AND CHARLES WESTBROOK2
1 Department of Mechanical System Engineering
Takushoku University
Hachioji, Tokyo 193, Japan
2 Lawrence Livermore National Laboratory
P.O. Box 808
Livermore, CA 94551, USA
Experimental and detailed chemical kinetic modeling work has been performed to investigate the role of hydrocarbon oxidation in NO–NO2 conversion. An atmospheric pressure, quartz flow reactor was used to examine the dependence of NO oxidation to NO2 by hydrocarbon type, reaction temperature, and residence time. The five hydrocarbons examined were methane, ethylene, ethane, propene, and propane. In the experiment, probe measurement of the species concentrations was performed in the flow reactor using a mixture of NO(20 ppm)/air/hydrocarbon(50 ppm) at residence times from 0.16 to 1.46 s and temperatures from 600 to 1100 K. In the chemical kinetic calculation, the time evolution of NO, NO2, hydrocarbons, and reaction intermediates were evaluated for a series of the hydrocarbons and the tem- peratures. The chemical mechanis m consisted of 639 reversible reactions and 126 species.
Experimental results indicate that, in general, ethylene and propane effectively oxidize NO to NO2 while methane is less effective. The calculation indicates the important chemical kinetic features that control NO–NO2 conversion for each hydrocarbon type. The dependence of NO–NO2 conversion with hydrocar- bon type and temperature is qualitatively reproduced by the calculation. The calculation indicates that all five hydrocarbons oxidize NO to NO2 predominantly through NO + HO2 i NO2 + OH and that the contribution of oxidation by RO2 and HORO2 is minor. Highest effectiveness comes from hydrocarbons that produce reactive radicals (i.e., OH, O atom) that promote hydrocarbon oxidation and lead to additional HO2 production. On the other hand, if hydrocarbons produce radicals, such as methyl and allyl, which resist oxidation by O2, then these radicals tend to reduce NO2 to NO. Experimental results show that the effectiveness of hydrocarbons varies appreciably with temperature and only within the low-temperature range. Propane shows the greatest NO–NO2 conversion for the lowest temperatures. This ability is pri- marily due to the hydroperoxy-propyl plus O2 reactions as indicated by the sensitivity an alysis results.
Introduction
The main route to nitrogen dioxide (NO2) for- mation in combustion systems is through the oxida- tion of nitric oxide (NO). This process was originally investigated in order to explain the high proportion of NO2 found in NOx emissions from the exhaust of some gas turbine engines [1]. Moreover, the under- standing of the NO–NO2 conversion mechanis m is relevant to a number of issues including NO2 emis- sion from unflued space heaters, development of NOx control technologies, behavior of NO/NO2 in the atmosphere, formation and reduction chemistry of NOx, and the probe sampling techniques for NOx concentration measurements. Originally, the NO– NO2 conversion was thought to proceed through the rapid oxidation of NO by oxidative radicals without much attention to the effect of fuels on the conver- sion [2–4]. Although, in later studies, it was revealed that the conversion was greatly promoted by s mall quantities of fuels such as hydrocarbons, H2, CO, and methanol [5–9]. In our former experiment and model calculation of the NO–NO2 conversion in the mixing of hot combustion gas with cold air and nine different fuels [6], the results indicated that NO– NO2 conversion appeared only in the low-tempera- ture range and showed a strong dependence on fuel type. Thus, the interaction between the NO–NO2 reactions and the oxidation reactions of the fuel in the low-temperature range must be understood in order to explain the effect of fuel type on the NO– NO2 conversion and consequently to predict the NO–NO2 emission levels from combustion systems.The objective of the present study is to compare the experimental results obtained from a flow reac- tor with the calculated results of a detailed chemical model in order to understand the important con- trolling features of hydrocarbon oxidation kineticson the NO–NO2 conversion. The study is original as this effort represents a first attempt to compare the NO– NO2 conversion dependence by hydrocarbon type and reaction temperature through a combined effort of experiment and detailed chemical kinetic mod- eling. Previous experiment and detailed chemical ki- netic modeling studies have been conducted for methane [10,11] and ethylene [12] on NO–NO2 con- version, and our findings confirm those previous in- vestigations. The present study focuses on the NO– NO2 conversion found in C1 to C3 hydrocarbons, that is, methane, ethylene, ethane, propene, and propane. This problem is interesting not only in the area of NOx chemistry but also in low-temperature hydrocarbon oxidation chemistry that has been in- vestigated extensively in studies of engine knock, cool flames, and ignition phenomena [13– 15]. In the experiment, a probe measurement of species con- centrations was performed in an atmospheric pres- sure flow reactor using a mixture of NO(20 ppm)/ air/hydrocarbon (50 ppm). In the chemical kinetic calculations, the temporal evolution of NO, NO2, hy- drocarbons, and reaction intermediates for a series of hydrocarbon types and reaction temperatures is shown. The important chemical kinetic features that control the NO–NO2 conversion for each hydrocar- bon type are discussed.
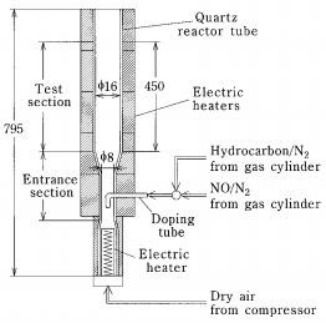 FiG. 1. Schematic of the flow reactor.
Experimental
Experimental Apparatus
The experiment was performed using a constant- temperature quartz flow reactor shown schemati- cally in Fig. 1. Dry air was supplied to an electric heater at the bottom end of the flow reactor and the air was heated to a desired reaction temperature. Just above the electric heater, an NO-hydrocarbon (balance N2) mixture was doped as a counterflow jet into the heated air stream. In the flow reactor, the initial NO (20 ppm)/air/hydrocarbon (50 ppm) mix- ture flowed up through the entrance section (mostly 8 mm i.d.) and into the test section (16 mm i.d., 450 mm length) as a reacting flow at constant tempera- ture. The types of hydrocarbons selected were meth- ane, ethylene, ethane, propene, and propane, and the reaction temperatures were controlled from 600 to 1100 K. Nearly uniform distribution of the species concentrations and temperature across the test sec- tion was confirmed before measurements were taken. Samples were withdrawn by a quartz sam- pling probe at 11 axial positions (which corre- sponded to residence times from 0.16 to 1.46 s) in the test section. To attain iso-kinetic sampling, the sampling probe was designed to have a larger sample inlet diameter than the diameter of the downstream sample tube. The samples were a nalyzed by achemi- luminescent NO–NOx an alyzer continuously and by three gas chromatographs with thermal conductivity detectors and a flame ionization detector with batch method. The species detected by the gas chromat- ographs were oxygen, nitrogen, hydrogen, carbon monoxide, carbon dioxide, and five hydrocarbons se- lected for the experiment.
Experimental Results and Discussion
According to the experimental results, the NOx concentration remains essentially constant with res- idence time for all the experimental conditions in- vestigated, and thus the decrease (increase) in the NO concentration corresponds to the increase (de- crease) in the NO2 concentration. When the hydro- carbons were not doped into the mixture, the NO2 concentration was below 1 ppm and did not vary with residence time. From these results, it is clear that only the NO–NO2 conversion occurs within the flow reactor and that the formation of considerable levels of NO2 is due to the role of hydrocarbon ox- idation in the NO–NO2 conversion.
The variations of the NO–NO2 conversion with hydrocarbon type that are shown as the NO2/NOx ratio against the residence time are discussed at first. At the reaction temperature of 700 K, only propane promotes the NO–NO2 conversion as shown in Fig.
2. In this case, it was found that only propane was consumed up to 30%, which resulted in the NO2/ NOx ratio above 0.9. At 800 K, four hydrocarbons except methane promote the NO–NO2 conversion, while, among them, ethylene and propane effec- tively oxidize NO to NO2, and ethane is less effective (see Figs. 4 and 5). Although at 1000 K, all five hy- drocarbons promote the NO–NO2 conversion, and the NO2/NOx ratios decrease gradually in the later stage of the NO–NO2 conversion due to the reduc- tion of NO2 to NO as shown in Fig. 3. In this case, it was found that the concentrations of five hydro- carbons decreased monotonically against the resi- dence time. It is suggested from these experimental results that methane promotes the NO–NO2 con- version most weakly and that the simple relationship is not found between the amount of hydrocarbon consumption and the level of the NO2/NOx ratio.
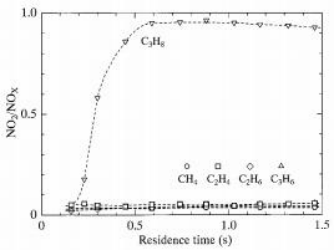
FiG. 2. NO2/NOx ratios against residence time obtained by the flow-reactor experiment for five hydrocarbons at 700 K.
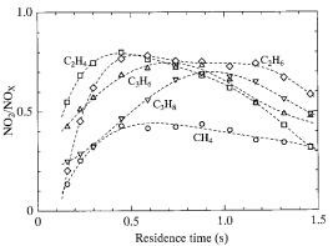
FiG. 3. NO2/NOx ratios against residence time obtained by the flow-reactor experiment for five hydrocarbons at 1000 K.
The effectiveness of hydrocarbons varies appre- ciably with reaction temperature and only within a low-temperature range (see Fig. 6). Propane shows the greatest NO–NO2 conversion for the lowest tem- peratures, and even methane and ethane show fairly large NO–NO2 conversion for the higher tempera- tures. The variations of the hydrocarbon consump- tion with the reaction temperature obtained in the experiment showed that the consumption was ac- celerated with increasing the reaction temperature.
Chemical Kinetic Calculations
Numerical Model
The numerical calculations were performed using the CHEMKIN-II/SENKIN computer programs [16,17]. The SENKIN code was used to compute the time evolution of a homogeneous reacting gas mixture in an adiabatic system at constant pressure. The detailed chemical kinetic model used in the nu- merical calculations was based on a hierarchical structure of hydrocarbon oxidation kinetics starting from hydrogen and building up to propane. The main portion of the detailed kinetics mechanis m was taken from our previous modeling work on hydrogen [18], methane [19], ethylene [20], ethane [19], pro- pane [21], and ethanol [22] flame chemistry. The chemical model was extended to include NOx chem- istry and was primarily taken from GRI-MECH2.11 [23], Dean and Bozzelli [24], and Atkinson [25]. The nitrogen compounds used in the mechanis m are N atom, NO, NO2, NO3, HNO, HONO, HONO2, HNO2, HNO3, NH, NH2, NH3, NNH, N2, N2O, CN, HCN, NCO, HCNO, HNCO, HOCN, H2CN, HCNN, CH3NO, CH3NO2, CH3ONO, CH3ONO2, and C3H5NO2. The chemical kinetic calculations performed for propane at temperatures less than ca.
800 K by the foregoing mechanis m showed no fuel conversion. A low-temperature chemistry subme- chanis m was added to the foregoing mechanis m to achieve the amount of reactivity observed in the ex- periments. These reactions were taken from Bozzelli and coworkers [26,27] and involve the addition of molecular oxygen to hydroperoxy-propyl radicals that eventually lead to OH radical formation and chain branching. Thermodynamic properties of the chemical compounds were obtained from the CHEMKIN Thermodynamic Database [28] or cal- culated by group additivity techniques as described by Benson [29] and fitted to a polynomial form using THERM [30]. The complete listing of the chemical kinetic mechanis m and thermodynamics used in the modeling portion of the study can be obtained from the authors [31]. The detailed chemical kinetic model consisted of 639 reversible reactions and 126 species.
Detailed Chemical Kinetic Calculations—Results
In this section, the calculated results are compared to the experimental results. The NO2/NOx ratio against the residence time at 800 K is shown in Fig.
4. The experiments indicate a s mall amount of NO is oxidized for methane and ethane, whereas the model suggests relatively little to no conversion for these fuels. The ethylene experimental data show a fairly rapid rise in NO conversion at early residence times and slowly levels out with time. The calcula- tion shows similar behavior, although the NO2/NOx ratio increases a little more rapidly at longer resi- dence times. The propene experimental data show a fairly linear increase in NO2 formation with time that is reproduced by the model calculation. Pro- pane exhibits nearly the same measured NO2/NOx profile as ethylene, although the calculation shows a greater oxidation of NO at the early residence times than indicated by the experiment. There are a num- ber of possibilities that could account for this dis- crepancy. The overpredicted oxidation of NO could be due to the inadequate understanding of the pro- pyl plus O2 chemical activation reaction process and inaccurate thermochemical assignments to the pro- pyl-O2 and hydroperoxy-propyl adducts.
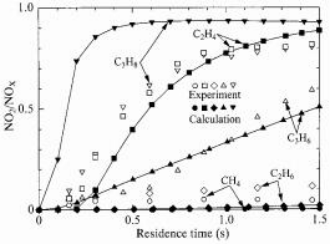
FiG. 4. Comparison between the flow-reactor experi- ment and the chemical kinetic calculation. NO2/NOx ratios against residence time for five hydrocarbons at 800 K.
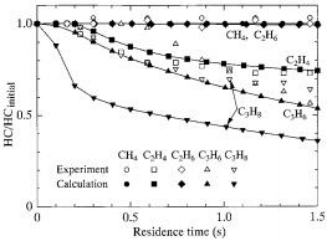
FiG. 5. Comparison between the flow-reactor experi- ment and the chemical kinetic calculation. Nondimen- sional hydrocarbon concentrations against residence time for five hydrocarbons at 800 K. (Hydrocarbon concentra- tions are nondimensionalized to the initial hydrocarbon concentrations.)
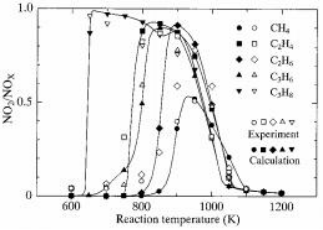
FiG. 6. Comparison between the flow-reactor experi- ment and the chemical kinetic calculation. NO2/NOx ratios at the residence time of 1.46 s against the reaction tem- perature for five hydrocarbons.
Figure 5 shows the hydrocarbon consumption with residence time at 800 K. The hydrocarbon con- centration has been nondimensionalized to the ini- tial hydrocarbon concentration of 50 ppm. Experi- mental results for methane and ethane are reproduced by the calculation and show very little hydrocarbon consumption with residence time. The experimental ethylene consumption profile is also well reproduced by the calculation. The propene ex- perimental data show a longer induction time prior to the start of its oxidation than indicated by the calculation. At longer residence times, the propene experimental consumption profile exhibits a linear change in concentration with residence time that is a similar characteristic exhibited by the calculation. The modeling results for propane show an over ox- idation of the fuel in comparison with the experi- mental data, and the causes for this disagreement have been previously discussed in connection to the over oxidation of NO with residence time.
The calculated change in the NO2/NOx ratio with temperature is compared to measurement in Fig. 6. The NO2/NOx ratios for five hydrocarbons are rea- sonably reproduced by the model. The model was able to reproduce qualitatively the low-temperature NO–NO2 conversion behavior for propane, and the mechanis m for this behavior is discussed in the next section.
Computer simulations were also performed for HO2 and NO2 loss within the reactor. We assumed the wall destruction of HO2 and NO2 as the rate- limiting case (i.e., HO2 and NO2 diffusion to the wall surface is fast) for HO2 and NO2 loss within the reactor. An HO2 and NO2 sticking coefficient of (no higher than) 1.0 × 10__4 and 1.0 × 10__6, respectively, were determined as appropriate values based on these experimental measurements. Our calculations show that these reasonable sticking co- efficient values result in no loss of HO2 and NO2 to the reactor walls.
Detailed Chemical Kinetic Calculations—An alysis
Reaction flux calculations indicate that all five hy- drocarbons oxidize NO to NO2 predominantly through the NO + HO2 i NO2 + OH mechanis m for the operating conditions examined in this study. Alkyl, alkenyl, or hydroxyalkyl plus molecular oxygen addition and subsequent stabilization of the adduct does not produce any appreciable concentration of these peroxy species that would otherwise convert the NO to NO2 via (RO2 or HORO2) + NO i (RO + HORO) + NO2. This particular NO–NO2 con- version step was found to contribute less than 15% to NO–NO2 conversion at the lowest temperature examined. Our numerical computations strongly suggest that the effectiveness of hydrocarbon type toward NO–NO2 conversion depends on the hydro- carbon’s propensity to produce reactive radicals like OH to sustain fuel oxidation while simultaneously producing HO2 radicals for subsequent NO–NO2 conversion. The production source of HO2 is deter- mined to occur primarily through the reaction steps of Alkyl + O2 i Olefin + HO2 (e.g., alkyl = iC3H7, nC3H7, C2H5), Alkyl-O2 i Olefin + HO2, HCO + O2 i CO2 + HO2, and H + O2 + M i HO2 + M for the fuels studied at one atmosphere.Methane does not readily promote NO–NO2 con- version in comparison to other alkane fuels as sug- gested in Figs. 4 and 6. This is primarily due to the slow nature of methane oxidation that produces a limited amount of HO2 radicals and the role of methyl radicals in reducing NO2 via CH3 + NO2 i CH3O + NO. The CH3 radical, produced pre- dominantly from CH4 + OH, is difficult to oxidize by molecular oxygen as direct abstraction of H atom by O2 is ca. 62 kcal/mol endothermic, and CH3 + O2 i CH3O + O has an energy barrier of ca. 30 kcal/mol [19], thereby making this reaction enthalp- ically unfavorable at these temperatures. Instead, methyl radical is initially oxidized by CH3 + O2 i CH2O + OH. A rate constant of 3.51 × 10¹¹ exp(__7368 K/T) cm3 mol__1 s__1 is used in the mech- anis m and is in agreement with Grela et al. [32]. This reaction initially sustains the early stages of methane oxidation and allows the HO2 concentration to be- come established through the reaction steps of CH2O + OH i HCO + H2O, HCO + O2 i CO + HO2, CO + OH i CO2 + H, and H + O2 + M i HO2 + M. The HO2 reacts with NO to make NO2 and OH, whereupon the OH is recycled back to oxidize additional methane, formaldehyde, and CO. The NO2 can further oxidize methyl through CH3 + NO2 i CH3O + NO. This reaction allows the net production of OH radical to increase via CH3O(+M) i CH2O + H( + M), H + O2 + N2 i HO2 + N2, H + O2 i OH + O, and NO + HO2 i NO2 + OH. As the temperature is raised, the amount of NO2 formed increases as methane becomes further oxidized but is limited in conver- sion due to the slow HO2 production rate and fast NO2 reduction to NO by CH3. The NO-to-NO2 ox- idation process then declines at the highest tem- peratures as H + O2 i OH + O dominates over H + O2 + M i HO2 + M, thereby limiting HO2 formation, and the additional O atom formed aids in NO2 reduction via NO2 + O i NO + O2.
Ethylene readily promotes the conversion of NO to NO2, as shown in Figs. 4 and 6, due to the main oxidation pathways producing HO2 and reactive rad- icals like OH and O atom for further ethylene con- version to products. Ethylene is primarily consumed by the OH radical to make C2H3 and H2O. The C2H3 is oxidized by two competing pathways [34], and the net reaction schemes can be expressed as:
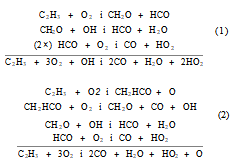
In reaction sequence 1, two HO2 molecules may form per ethylene consumed, thus making this path- way effective in promoting NO to NO2. Reaction sequence 2 is an important chain-propagating path- way that sustains ethylene oxidation and indirectly allows ethylene to convert NO to NO2 at lower tem- peratures than ethane. The unique synergistic effect of reaction sequences 1 and 2 in ethylene is different from the oxidation kinetics found in ethane. In eth- ane, the C2H5 + O2 i C2H4 + HO2 reaction pri- marily controls radical production, and HO2 is an unreactive radical that does not contribute to the consumption of ethane via C2H6 + HO2 i C2H5
+ H2O2. This limits the extent of ethane consump- tion, thereby constraining the rate of NO-to-NO2 conversion in the 750–850 K temperature range. These are the important chemical kinetic differences between ethylene and ethane at the low tempera- tures. The highest temperatures examined in the ethylene case showed the conversion of NO to NO2 declining for the same reasons as discussed previ- ously for the methane case.
Ethane shows a greater NO–NO2 conversion rela- tive to methane as indicated in Figs. 4 and 6. This is primarily due to the ease of producing HO2 from C2H5 + O2 i C2H4 + HO2 and the subsequent radical production that occurs as C2H4 is consumed. Ethane is primarily oxidized by OH to make C2H5 and H2O. The ethyl radical reacts with O2 and either collisionally stabilizes to the peroxy compound, C2H5O2, or forms C2H4 + HO2 through the chem- ically activated reactions of C2H5 + O2 i C2H4 + HO2 or C2H5 + O2 i C2H5O2 followed by C2H5O2 i C2H4 + HO2. The C2H5 + O2 i C2H4 + HO2 reaction exhibits an overall exothermicity of ca. 12 kcal/mol and has no energy barriers greater than the entrance channel’s incoming energy. The favorable thermodynamics portrayed in C2H5 + O2 i C2H4 + HO2 opposed to CH3 + O2 i CH2 + HO2 allows for rapid HO2 production in ethane oxidation while simultaneously consuming C2H5, thus limiting its participation in NO2 reduction kinetics via C2H5 + NO2 i CH3CH2O + NO. These are important differences when considering the NO–NO2 promo- tion effect between ethane and methane fuels.
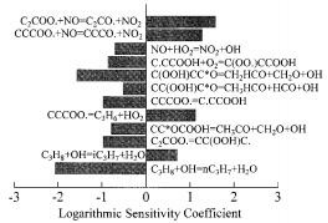
FiG. 7. Propane sensitivity an alysis at 650 K. The loga- rithmic sensitivity coefficient determined by perturbing re- action’s pre-exponential term by a factor of 1.3 and calcu- lating the new NO value relative to the baseline, unperturbed case. A negative (positive) coefficient indi- cates the reaction promotes (reduces) NO–NO2 conver- sion.
The NO–NO2 conversion in propene oxidation lies between ethylene and ethane as shown in Figs.
4 and 6. The conversion is not as great as ethylene primarily due to NO2 reduction via aC3H5 (allyl) + NO2 i CH2CHCH2O + NO, yet the conversion temperature range is wider than ethane due to the greater carbon content of propene introduced into the reactive flow. Propene is initially consumed by O2 to produce aC3H5 and HO2. The NO + HO2 i NO2 + OH reaction provides the initial source of OH radicals for propene consumption. Propene is primarily removed by OH to make aC3H5 and H2O. Allyl is a resonantly stabilized radical that is difficult to oxidize by O2. This may be explained by noting the rate-determining energy barriers for allyl-O2 isomerization to products typically exceeds the allyl + O2 incoming energy by at least 12 kcal/mol [34], and the ca. 20 kcal/mol bond strength of allyl-O2 suggests allyl-O2 dissociation will tend to dominate over any product formation processes. Allyl’s ability to resist O2 oxidative attack allows aC3H5 to react with NO2 via aC3H5 + NO2 i CH2CHCH2O + NO an alogous to CH3 + NO2 i CH3O + NO. The CH2CHCH2O radical produced by this NO2 re- duction step then decomposes to acrolein and H atom and makes this a reactive chain sequence. The acrolein is consumed by OH to form CH2CHCO and CHCHCHO. The CH2CHCO decomposes to C2H3 + CO, and CHCHCHO reacts with O2 to make C2H2 + CO + HO2. Acrolein is also removed by O atom to produce CH2HCO (vinoxy) and HCO radicals. Interestingly, the acrolein oxidation se- quence yields radicals typically found in ethylene ox- idation [33]. The consumption of C2H3 and CH2HCO by O2 yields CH2O, HCO, and radicals like OH, O atom, and HO2. The reaction of C3H6 + OH i C3H6OH followed by HOC3H6 + O2 i HOC3H6O2 and HOC3H6O2 + NO i HOC3H6O + NO2 is of secondary importance to NO–NO2 con- version. Propene reactions with O atom to form C2H5 + HCO or CH3CO + CH3 products are of minor importance in the overall propene oxidation chemistry for this study, although these reactions provide additional sources of HO2 and CH3 radicals.
Propane shows the greatest NO–NO2 conversion for the lowest temperatures and widest temperature range of all five fuels studied both experimentally and computationally. The ability of propane to con- vert NO to NO2 at the lower temperatures is pri- marily due to the hydroperoxy-propyl plus O2 reac- tions that lead to the production of oxygenates and two OH radicals. The OH radicals further consume propane through C3H8 + OH i iC3H7 + H2O and C3H8 + OH i nC3H7 + H2O. The generated pro- pyl radicals react with O2, and this leads to two pos- sible general outcomes. The reaction could produce HO2 via chemically activated routes of iC3H7 + O2 i C3H6 + HO2 and nC3H7 + O2 i C3H6 + HO2, iC3H7 + O2 i iC3H7O2 followed by iC3H7O2 i C3H6 + HO2, and nC3H7 + O2 i nC3H7O2 fol- lowed by nC3H7O2 i C3H6 + HO2, or the reaction could form the stabilized hydroperoxy-propyl (or C3H6OOH) adduct. The degree of reactivity exhib- ited in propane is essentially controlled by the com- petition of chemically activated reactions producing HO2 and olefin (i.e., C3H6) versus the partial equi- librium established in the C3H7 + O2 i C3H7O2 i C3H6OOH reaction sequence as determined from reaction flux an alysis and suggested by the sen- sitivity an alysis results for NO in Fig. 7. The stabi- lized hydroperoxy-propyl adduct readily reacts with O2 and establishes a partial equilibrium with O2C3H6OOH. The O2C3H6OOH species under- goes internal H atom abstraction to make HOOC3H5OOH [e.g., C(OO.)CCOOH i C(OOH)CC.OOH] followed by beta-scission of the O–O bond leading to a ketohydroperoxide [e.g., C(OOH)CC*O] and OH radical. The ketohydro- peroxides primarily undergo O–O bond scission that leads to further OH radical production, chain branching, and propane consumption. The decom- position of the ketohydroperoxides increases NO– NO2 conversion as indicated by the negative sensi- tivity coefficients shown for the C(OOH)CC*O i CH2HCO + CH2O + OH, CC(OOH)C*O i CH3HCO + HCO + OH, and CC*OCOOH i CH3CO + CH2O + OH reactions. Sensitivity an al- ysis shows hydroperoxy-propyl plus O2 reactions, and the ketohydroperoxide decomposition reactions play an important promoting role in the NO–NO2 conversion for propane.
The sensitivity an alysis results for NO + HO2 i NO2 + OH showed a relatively s mall sensitivity co- efficient in spite of its importance in promoting NO– NO2 conversion. Reaction flux an alysis indicates that this reaction dominates HO2 consumption, and therefore, a s mall perturbation in the rate constant A-factor leads to a minor effect on the NO conver- sion. The reactions of nC3H7O2 or iC3H7O2 with NO exhibit larger in magnitude sensitivity coeffi- cients than NO + HO2 i NO2 + OH because these reactions reduce the net production of alkyl- peroxy species and, in effect, indirectly limit OH and HO2 radical production, thereby slowing the NO-to- NO2 conversion rate as well.
Conclusions
The flow-reactor experiment indicated the follow- ing results:
1. In general, ethylene and propane effectively oxi- dize NO to NO2 while methane and ethane are less effective.
2. High NO2/NOx ratios are obtained only within a relatively low reaction temperature range from
650 to 1000 K, though the hydrocarbon con- sumption is accelerated with increasing the re- action temperature. At higher reaction tempera- tures, the reduction of NO2 to NO is observed at longer residence times.
The chemical kinetics modeling indicated the fol- lowing results:
1. The kinetic calculation reproduces the experi- mental results qualitatively for the dependence of NO–NO2 conversion with hydrocarbon type and reaction temperature.
2. Highest level of NO–NO2 promotion comes from hydrocarbons that produce reactive radicals (i.e., OH, O atom) that further consume the parent hydrocarbon while at the same time producing HO2 radicals for NO–NO2 conversion via NO + HO2 i NO2 + OH (propane and ethylene).
3. If parent hydrocarbons (i.e., CH4, C3H6) produce daughter radicals (i.e., CH3, aC3H5) that are re- sistant to oxidation by O2, then the daughter rad- icals will reduce NO2 to NO via the reaction R + NO2 i RO + NO (R = CH3, aC3H5). This reaction limits NO-to-NO2 conversion. The R + NO2 i RO + NO reaction type was found to be important in the methane and propene stud- ies.
4. If the parent fuel can be oxidized to C2H4 or C2H3, then NO will be readily promoted to NO2 as reactive radicals (i.e., OH, O atom) and HO2 are produced when C2H3 is oxidized by O2 (pro- pene and ethane).
Acknowledgments
The authors would like to acknowledge the work of Ya- sunori Kouno and Yasunori Kawai in the experiment. The experimental and modeling work were performed respec- tively under the auspices of the Japan Ministry of Educa- tion (Contract Number 05650208) and the U.S. Depart- ment of Energy by the Lawrence Livermore National Laboratory (Contract Number W-7405-ENG-48).
REFERENCES
1. Cernansky, N. P., in Progress in Astronautics and Aer- onautics, vol. 53, AIAA, 1977, p. 83.
2. Sano, T., Combust. Sci. Technol. 38:129–144 (1984).
3. Hori, M., in Twenty-First Symposium (International) on Combustion, The Combustion Institute, Pitts burgh, 1986, pp. 1181–1188.
4. Hori, M., in Twenty-Second Symposium (Interna- tional) on Combustion, The Combustion Institute, Pitts burgh, 1988, pp. 1175–1181.
5. Bromly, J. H., Barnes, F. J., Johnston, R. C. R., and Little, L. H., J. Inst. Energy 58:188–196 (1985).
6. Hori, M., Matsunaga, N., Malte, P. C., and Marinov, N. M., in Twenty-Fourth Symposium (International) on Combustion, The Combustion Institute, Pitts burgh, 1992, pp. 909–916.
7. Bromly, J. H., Barnes, F. J., Mandyczewski, R., Ed- wards, T. J., and Haynes, B. S., in Twenty-Fourth Sym- posium (International) on Combustion, The Combus- tion Institute, Pitts b urgh, 1992, pp. 899–907.
8. Nelson, P. F. and Haynes, B. S., in Twenty-Fifth Sym- posium (International) on Combustion, The Combus- tion Institute, Pitts burgh, 1994, pp. 1003–1010.
9. Lyon, R. K., Cole, J. A., Kramlich, J. C., and Chen, S. L., Combust. Flame 81:30–39 (1990).
10. Sano, T., Combust. Sci. Technol. 43:259–269 (1985).
11. Bromly, J. H., Barnes, F. J., Muris, S., You, X., and Haynes, B. S., Combust. Sci. Technol. 115:259–296 (1996).
12. Doughty, A., Barnes, F. J., Bromly, J. H., and Haynes, B. S., in Twenty-Sixth Symposium (International) on Combustion, The Combustion Institute, Pitts burgh, 1996, pp. 589–596.
13. Westbrook, C. K., Pitz, W. J., and Leppard, W. M., SAE Trans., SAE Paper No. 91-2314.
14. Chevalier, C., Pitz, W. J., Warnatz, J., and Westbrook, C. K., in Twenty-Fourth (International) Symposium on Combustion, The Combustion Institute, Pitts burgh, 1992, pp. 93–101.
15. Benson, S., Prog. Energy Combust. Sci. 7:125–154 (1981).
16. Kee, R. J., Rupley, F. M., and Miller, J. A., CHEMKIN- II: A Fortran Chemical Kinetics Package for the An al- ysis of Gas Phase Chemical Kinetics, Sandia National Laboratories Report, SAND89-8009B UC-706, 1989.
17. Lutz, A. E., Kee, R. J., and Miller, J. A., SENKIN: A Fortran Program for Predicting Homogeneous Gas Phase Chemical Kinetics with Sensitivity An alysis, SANDIA National Laboratories Report, SAND87- 8248 UC-401.
18. Marinov, N. M., Westbrook, C. K., and Pitz, W. J., in Eighth (International) Symposium on Transport Pro- cesses, vol. 1, 1995, pp. 118–129.
19. Marinov, N. M., Pitz, W. J., Westbrook, C. K., Castaldi, M. J., and Senkan, S. M., Combust. Sci. Technol., 116– 117:211–287 (1996).
20. Castaldi, M. J., Marinov, N. M., Melius, C. F., Huang, J., Senkan, S. M., Pitz, W. J., and Westbrook, C. K., in Twenty-Sixth Symposium (International) on Combus- tion, The Combustion Institute, Pitts b urgh, 1996, pp. 693–702.
21. Marinov, N. M., Castaldi, M. J., Melius, C. F., and Tsang, W., Combust. Sci. Technol. 128:295–342 (1997).
22. Marinov, N. M., “A Detailed Chemical Kinetic Model for High Temperature Ethanol Oxidation,” Int. J. Chem. Kinet., in press (1998).
23. Bowman, C. T., Hanson, R. K., Davidson, D. F., Gar- diner Jr., W. C., Lissianski, V., S mith, G. P., Golden, D. M., Frenklach, M., and Goldenberg, M., http:// www.me.berkeley.edu/gri mech/1997.
24. Dean, A. M. and Bozzelli, J. W., in Combustion Chem- istry II, (W. Gardiner Jr., ed.), Springer-Verlag, New York, 1997.
25. Atkinson, R., Baulch, D. L., Cox, R. A., Hampson Jr., R. F., Kerr, J. A., and Troe, J., J. Phys. Chem. Ref. Data 21:1125–1568 (1992).
26. Bozzelli, J. W. and Pitz, W. J., in Twenty-Fifth Sym- posium (International) on Combustion, The Combus- tion Institute, Pitts burgh, 1995, pp. 783–791.
27. Koert, D. N., Pitz, W. J., Bozzelli, J. W., and Cernan- sky, N. P., in Twenty-Sixth Symposium (International) on Combustion, The Combustion Institute, Pitts burgh, 1996, pp. 633–640.
28. Kee, R. J., Rupley, F. M., and Miller, J. A., The CHEM- KIN Thermodynamic Database, Sandia National Lab- oratories Report, SAND86-8246, 1986.
29. Benson, S. W., Thermochemical Kinetics, 2nd ed., Wi- ley, New York, 1976.
30. Ritter, E. R. and Bozzelli, J. W., Int. J. Chem. Kinet. 23:767–778 (1991).
31. marinov1@llnl.gov or Marinov, N. M., LLNL Report, UCRL-JC-129372, 1998.
32. Grela, M., Amorebreta, V. T., and Colussi, A., J. Phys. Chem. 96:7013–7018 (1992).
33. Marinov, N. M. and Malte, P. C., Int. J. Chem. Kinet. 27:957–986 (1995).
34. Bozzelli, J. W. and Dean,
COMMENTS
Anders B. Bendtsen, Technical University of Denmark, Denmark. You are not using the heat of formation of CH3O2 suggested by Bromly [1]. Do you have a comment of the effect of using a lower heat of formation for CH3O2 on the initial oxidation of NO through the reactions CH3O2 (` M) → CH3O2 (` M) and CH3O2 ` NO → CH3O `NO2?
REFERENCE
1. Bromly, J. H., Barnes, F. J., Muris, S., You, X., and Haynes, B. S., Combust. Sci. Technol. 115:259–296 (1996).
Author’s Reply. Calculations were performed at 950 K for the NO (20 ppm)/air/CH4 (50 ppm) case by reducing the CH3O2 heat of formation value from Tsang’s recom- mendation of 6.7 kcal/mol to Bromly’s value of 2.7 kcal/mol (Ref. [11] in the paper). We find the change in the CH3O2 heat of formation value results in additional CH3 con- sumption via CH3 + O2 ↔ CH3O2 (due to the shift in equilibrium) and a slightly greater NO-to-NO2 conversion. The greater NO-to-NO2 conversion is primarily due to the lower CH3 concentration that limits the amount of NO2 reduction to NO by CH3 + NO2 ↔ CH3O + NO than
the gain from CH3O2 + NO ↔ CH3O + NO2. The pre- dominant NO-to-NO2 conversion mechanis m is still NO + HO2 ↔ NO2 + OH.
One additional point should be made regarding heat of formation choices. The CH3 + O2 reaction has three pos- sible products CH3O2, CH2O + OH, and CH3O + O. The most important products for the conditions of this study are CH3O2 and CH2O + OH, where CH3O2 is in- termediary to CH2O + OH from the chemical activation process of CH3 + O2 ↔ CH3O2 ↔ CH2OOH ↔ CH2O + OH. Any adjustment to the CH3O2 heat of formation will affect the rate-limiting CH3O2 ↔ CH2OOH barrier height (relative to the CH3 + O2 entrance channel energy) for CH3 + O2 ↔ CH2O + OH. A lower heat of formation for CH3O2 will require a faster CH3 + O2 ↔ CH2O + OH rate constant. This is noted by the difference in the CH3 + O2 ↔ CH2O + OH rate expression assignments where Marinov has 3.51 × 10¹¹ exp(__7368 K/T) cm3/mol/ s while Bromly has 3.31 × 10¹¹ exp(__4500 K/T). The difference in activation energy nearly reflects the differ- ence in CH3O2 heat of formation values used. Modeling agreement was better with our choice of CH3O2 heat of formation and CH3 + O2 ↔ CH2O + OH rate expression than Bromley’s values. Additional work is required here.
详细内容请见附件
免责声明:
本页面/内容部分素材来源于互联网公 开 信 息,旨在传递更多信息,不代表本平台立场。
版权归原作者或机构所有,如涉及侵权,请通过平台联系我们,我们将在核实后第一时间处理。
本平台对转载内容的真实性、准确性不作任何保证,用户需自行判断并承担使用风险。