Chemkin-Pro气相燃烧过程:高压下甲烷氧气氮气混合物真实气体模型点火延迟时间预测教程

Chemkin-Pro气相燃烧过程:高压下甲烷氧气氮气混合物真实气体模型点火延迟时间预测教程(chemkin_real_gas_tutorial_181)
摘要:
本文为 Chemkin‑Pro 真实气体模型教程,讲解高压下气相燃烧点火延迟仿真方法。内容包含丙烷均相绝热着火延迟计算,以及甲烷 / 氧气 / 氮气混合气在 130–180 atm 高压下的真实气体效应模拟。教程介绍闭均相反应器设置、点火判据(温度拐点、OH 峰值浓度)、参数化研究流程,重点说明范德华、SRK、PR 等立方型状态方程的启用方法与真实气体物性块(EOS_)编写规则。对比理想气体与真实气体模型结果,证实高压下必须考虑分子体积与相互作用。文件为.ckprj 项目与.inp 机理提供标准化操作流程,适用于激波管验证与发动机工况仿真。
2 Combustion in Gas-phase Processes
Real-gas Model Prediction of Ignition-delay Times for CH4/O2/N2Mixture at High Pressures follows Section 2.1.1, Ignition-delay Times for Propane Autoignition. The two tutorials are related so both are presented here.
2.1 Ignition, Flames and Flammability
2.1.1 Ignition-delay Times for Propane Autoignition
2.1.1.1 Project Description
This tutorial is based on a fully configured sample project that contains the tutorial project settings. The description provided here covers the key points of the project set-up but is not intended to explain every parameter setting in the project. The .ckprj file has all custom and default parameters already configured; the text highlights only the significant points of the tutorial.
This user tutorial presents an ignition-delay time calculation for the homogeneous, isobaric, adiabatic combustion of propane in air. The ignition times are computed using two distinct definitions. Discrepancies between results are presented.
Premixed combustion technology is well established in the gas turbine industry. One of the major concerns of such technology, however, is avoiding the autoignition phenomenon to protect combustor components as well as to limit levels of pollutant emissions. Numerical predictions of the ignition time can be very useful in understanding the autoignition parameters, which can be important for the automotive and turbine industries. Chemical kineticists can also benefit from predicting ignition times. Work in validation and testing of detailed mechanis ms as well as reduction of detailed mechanis ms often requires an alyzing ignition times. One of the better-known validation techniques for detailed chemical kinetic mechanis ms consists of comparing computational predictions of the ignition-delay times to shock-tube experiments.1, 2, 3 Such comparisons can provide a good understanding of the underlying chemistry, since the 0-D computations are free from transport effects.
There are various ways of defining the ignition time, experimentally as well as computationally, for combustion applications. For example, it is often defined as the time at which either the maximum or onset of certain species concentrations is reached, the time at which a specified rate of increase of temperature occurs, the time at which luminous radiant output from the system is first observed, etc. The reported experimental data can vary greatly, depending on which definition was used in the experiments2, 4. Thus, it is often useful to select which ignition-delay time definition should be used in numerical computations. Chemkin-Pro allows the user such flexibility. For example, in Chemkin-Pro's closed homogeneous batch reactor, the ignition time can be defined to be the time during which the maximum amount of heat is released during a combustion process (as indicated by the inflection point in the temperature profile), as well as the time corresponding to the maximum of a certain species concentration chosen by the user. Chemkin-Pro further allows users to input a specific definition of the ignition time via the Ignition Criterion User Routine.
2.1.1.2 Project Setup
The project file is called closed_homogeneous ignition_delay.ckprj. The data files used for this sample are located in the samples\closed_homogeneous\transient\ignition_delay directory. This sample uses the mechanis m and thermodynamic data from the University of California, San Diego3, 5. This reactor diagram contains only one closed homogeneous reactor.
Open the project file. After running the Pre-Processor step, on the Reactor Physical Properties tab of the C1_Closed Homogeneous panel, the problem type is selected as Constrain Pressure And Solve Energy Equation (the default). The initial temperature (1200 K) is then input, along with the pressure (1 atm). A volume is not specified as it is not important for the results of this simulation, so the default value of 1 cm3 will be used for the initial volume. Since this is an isobaric closed homogeneous system, the results in terms of species fraction and temperature will be the same, regardless of the volume value. If surface chemistry were included, the volume-to- surface ratio would be important, but in this case only gas-phase chemistry is present. On the Reactant Species sub-tab, the starting gas mixture is given as 0.02 C3H8, 0.05 O2, and 0.93 Ar. These rather dilute conditions are representative of shock-tube experimental conditions.
The end time is specified on the Reactor Physical Properties panel. It is important to check the resulting output file after the run is complete to make sure that the End Time is large enough to allow for ignition to occur. If no ignition time is provided at the end of the output file, ignition has not yet occurred and the End Time of the simulation should be adjusted.
On the Output Control tab, on the Ignition Delay sub-tab, the Temperature Inflection Point box is checked as well as Species Maximum Fraction, for the computational ignition time criteria. Species Maximum Fraction is set to the OH species. This means the ignition time will be computed based on the maximum of the OH concentration. The user can choose any species from the pull-down menu. The ignition time will also be computed at the point where the rate of change of temperature with respect to time is the largest (Temperature Inflection Point criteria). The user can choose any or all of the definitions of ignition times provided by Chemkin-Pro.
It is of interest to run the same problem, but vary the initial temperature in order to demonstrate ignition time dependence on temperature as well as its dependence on the chosen ignition time criteria. For this purpose Chemkin-Pro's Parameter Study Facility is used. The initial Temperature is changed over a range of 1200 - 2600 K. Please refer to the ANSYS Chemkin-Pro Advanced An alyses Manual for guidance in setting up a Parameter Study.
Once the project is run, the ignition times (based on peak OH concentration and temperature inflection point) for the three runs are printed in the text output files and also stored in the solution files, stored in the closed_homogeneous ignition_delay_<date>_<time> folder, contained in your working directory. You can look at the output files by clicking on Click to View Results under Run Calculations, using the Display Detail option.
2.1.1.3 Project Results
On the Run Calculations panel, click on Display Detail and then on Click to View
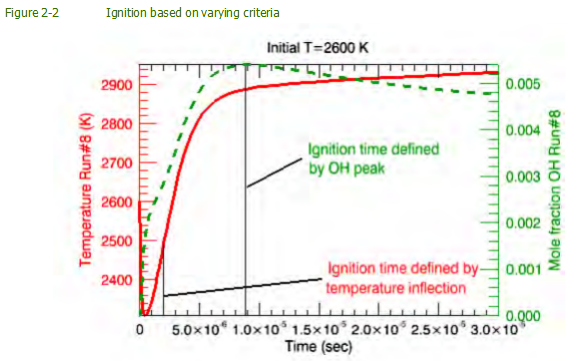
Results to view the output files corresponding to each temperature. Table 2-1 lists the initial temperatures as well as ignition times based on temperature inflection and OH concentration maximum for some of the runs obtained from the bottom of the output files. The ignition times based on the two criteria differ more and more with increasing initial temperature. Looking at temperature and OH mole fraction profiles will give the user better insight as to how the ignition times are obtained.
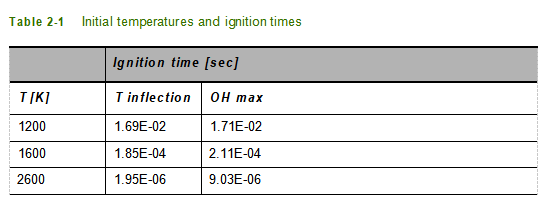
Figure 2-1 shows OH mole fraction and temperature profiles as a function of time, for the 1200-K case, obtained with Chemkin-Pro's Graphical Post-processor. The solid line is the temperature profile and the dashed line is the OH mole fraction. There is an obvious spike in OH mole fraction at the time of ignition, which in this lower-temperature case corresponds very nicely to the maximum rate of change of the
temperature (the inflection point). This is also a good example of how one should be careful when interpreting numerical results for ignition times. In this example,
Chemkin-Pro produces two numbers for ignition times for the OH mole fraction peak. Only one of these numbers represents the ignition time.
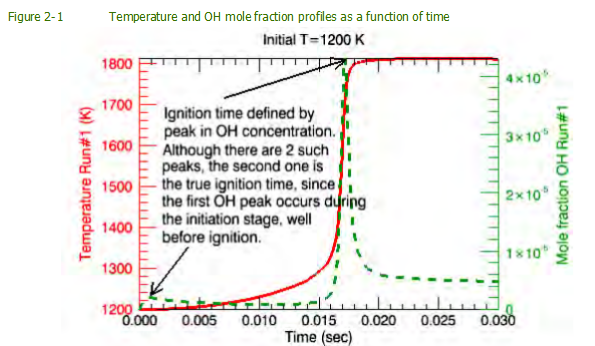
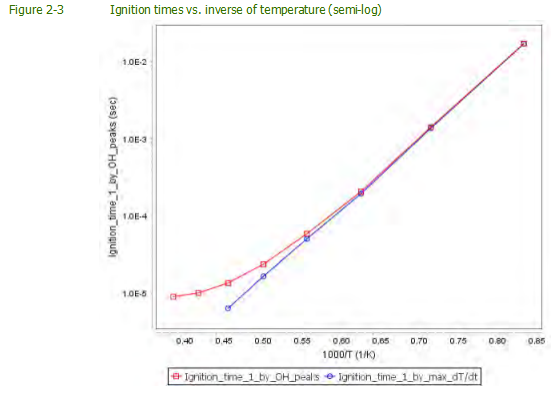
In Figure 2-2, there is an obvious difference (about a factor of four) between the ignition time values as defined by the two chosen criteria. This plot demonstrates why one should be mindful of ignition time definitions used in computations. The solid line is the temperature profile and the dashed line is the OH mole fraction.
Finally the ignition times vs. the inverse of temperature are shown in Figure 2-3 on a semi-log plot. Here the difference between the two ignition time definitions is obvious.
2.1.2 Real-gas Model Prediction of Ignition-delay Times for CH4/O2/N2 Mixture at High Pressures
2.1.2.1 Project Description
This tutorial is based on a fully configured sample project that contains the tutorial project settings. The description provided here covers the key points of the project set-up but is not intended to explain every parameter setting in the project. The .ckprj file has all custom and default parameters already configured; the text highlights only the significant points of the tutorial.
This tutorial presents the important steps of using the real gas equation of state (EOS) to calculate ignition-delay times for a methane/oxygen/nitrogen mixture at elevated pressures. The project file for this tutorial project is named closed_homogeneous CH4_IgnitionDelay_RealGas.ckprj, located in the samples directory.
When the reactor pressure is high, the real gas effects, that is, the volume of gas molecules and interactions between gas molecules, can be significant. In these simulation situations, it is necessary to substitute the ideal gas law with the real gas equations of state. The five cubic equations of state available for simulations involving a real gas mixture are listed here.
Available Cubic Equation of State Models in Chemkin-Pro:
• Cubic Equation of State (EOS)
• van der Waals
• Redlich-Kwong
• Soave-Redlich-Kwong
• Aungier-Redlich-Kwong
• Peng-Robinson
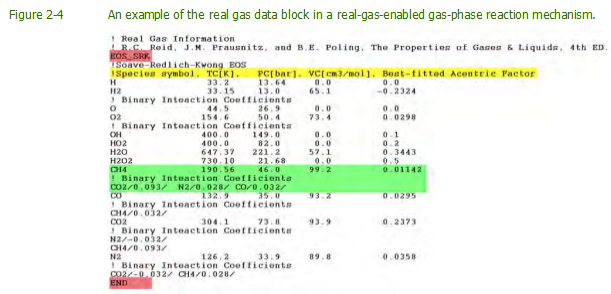
Descriptions of these cubic equations of state can be found in Section 2.4.1 of the ANSYS Chemkin-Pro Tutorials Manual and in references cited there. Since evaluation of parameters in the cubic EOS requires critical point properties and other data of the gas species, these additional real gas data must be provided as part of the gas-phase reaction mechanis m. In ANSYS Chemkin-Pro, the species real gas data are given in the real gas data block located between the SPECIES block and the REACTION block of the mechanis m. The beginning of the real gas data block is indicated by the keyword EOS_. Critical point properties and the acentric factor of species in the mechanis m should be listed below the EOS_ keyword line and keyword END should be used to close the real gas data block. The format of the species real gas data is described in detail in Section 3.4 of the ANSYS Chemkin-Pro Input Manual. Note that critical point properties of many species, especially radicals, might not be available. Chemkin-Pro does not require all species to have their critical point properties to work. Any species that does not appear in the real gas data block will be treated as an ideal gas.
When a gas-phase reaction mechanis m containing the real gas data block is used in simulations with selected Chemkin-Pro reactor models (Closed Homogeneous, Plug- flow, Perfectly-stirred, Premixed Flame, and Opposed-flow Flame), the cubic EOS specified in the mechanis m can be switched on and off (the ideal gas law will be used) either through the Chemkin-Pro user interface, or by keywords.
The tutorial project uses a modified version of the chemistry set for the C2_NOx mechanis m described in this chapter in Section 2.9. 7. The real-gas data block is added to the mechanis m so that it can be used for assessing the real gas effects on ignition-delay times at high pressures. An example of the real gas data block similar to the one added to the C2_NOx mechanis m is shown in Figure 2-4. The EOS_ keyword in the mechanis m is appended with the phrase SRK, which indicates the Soave-Redlich-Kwong EOS will be applied to determine the P-T-V relationship of the gas mixture in the simulations. For species with known critical point properties, critical pressure Pc, critical temperature Tc, critical volume Vc, and the acentric are listed behind the species symbol on one line. The binary interaction coefficients, if known, are given on a separate line beneath the critical point property data. The binary interaction coefficient is used to calculate properties of a mixture containing real gas components. The default value of the binary interaction coefficient (between a pair of gas species) is zero. Species with no real gas data will be treated as an ideal gascomponent of the mixture. It is highly recommended to provide real gas data at least for the major species of the mixture, such as major fuel components.
The modified C2_NOx mechanis m, C2_NOx_SRK.inp, is included in the chemistry set, Real Gas C2_NOx.cks, that is packaged with this tutorial project.
The constant-volume closed homogeneous reactor model is used to predict the ignition-delay times of a CH4-O2-N 2mixture under high initial pressure for a series of initial temperatures. The composition of the initial gas mixture for this ignition-delay time study consists of a CH4-O2 mixture with an equivalence ratio of 3 and dilution of 54.5% N 2 . Two initial reactor pressures, 130 atm and 180 atm, will be studied with the initial gas temperature varying from 1000 K to 1400 K. The impact of real gas behavior on ignition-delay times will be assessed by comparing the results obtained with the cubic EOS turned on and turned off (i.e., ideal gas law).
2.1.2.2 Project Setup
This tutorial is a modification of the tutorial in Section 2.1.1, Ignition-delay Times for Propane Autoignition. The details of setting up an ignition-delay-time parameter-study project are already provided in that tutorial. Only the set-up steps relating to the real-gas EOS are described in this tutorial.
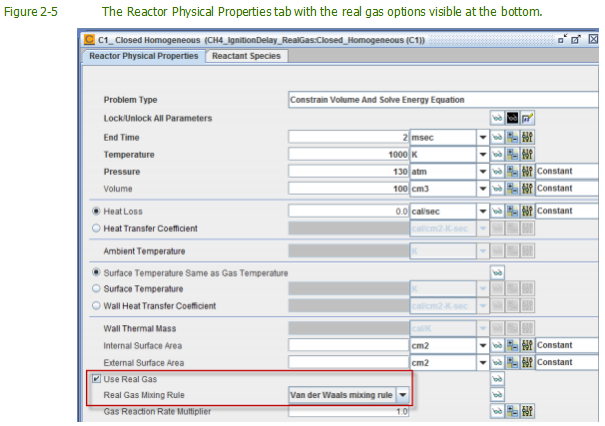
After the chemistry set with the modified C2_NOx mechanis m is loaded and pre-processed, the options related to the real gas EOS will be displayed near the bottom of the Reactor Physical Properties tab, as shown in Figure 2-5. The Use Real Gas box is unchecked by default because the ideal gas law is the default EOS of the Chemkin-Pro reactor models. Once the Use Real Gas box is checked, the Soave- Redlich-Kwong EOS specified in the reaction mechanis m will be used in the simulation. Chemkin-Pro offers two mixing rules to compute the properties of the real gas mixture: the van der Waals mixing rule and the pseudocritical mixing rule. These mixing rules are described in Section 2.4.2.1 of the ANSYS Chemkin-Pro Theory Manual. Since some species in the C2_NOx mechanis m do not have critical point properties, the van der Waals mixing rule must be used in the simulation. The pseudocritical mixing rule cannot be used in this case because the critical point properties of the gas mixture cannot be properly computed without knowing the critical point properties of all components. Choosing the pseudocritical mixing rule in this case will trigger an error at runtime.
The composition of the initial CH4-O2-N 2mixture should be specified under the Reactant Species tab. The mole fractions of the components are listed in Figure 2-6.

To make the reactor model report the ignition-delay time for each case, ignition indicators must be defined under the Ignition Delay tab on the Output Control panel. Figure 2-7 shows that three ignition-delay-time definitions are set up: inflection points of the temperature profile, temperature increase, and local peaks in the OH profile.
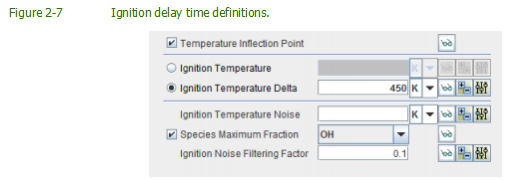
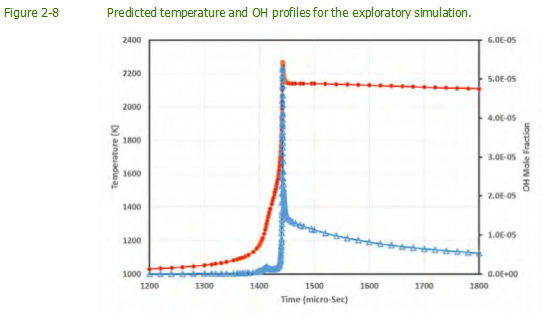
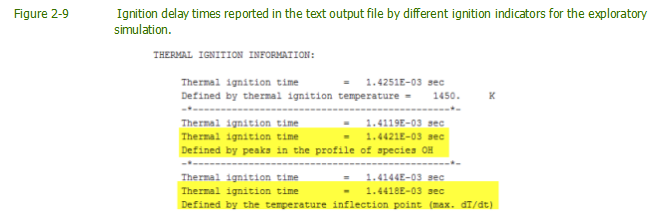
It is likely that the criteria defined in Figure 2-7 will be satisfied multiple times during the course of the simulation. Performing an exploratory simulation can help to identify the better ignition indicators and the occurrence associating with the "true" ignition event. The temperature and the OH profiles of the exploratory simulation, Ti = 1000 K and Pi = 130 atm, are presented in Figure 2-8, the ignition delay times determined by these ignition definitions are shown in Figure 2-9. Clearly the temperature increase criterion is not very good as the ignition time given by this definition does not fall near the times reported by the other two definitions. Therefore, the temperature increase definition is removed. Both temperature inflection point and the peak OH definitions give two ignition delay times. By examining the profiles of these two ignition indicators in Figure 2-8, the main ignition event should be associated to the second ignition delay time reported by the indicators. The main ignition delay times of this exploratory run are highlighted in Figure 2-9.
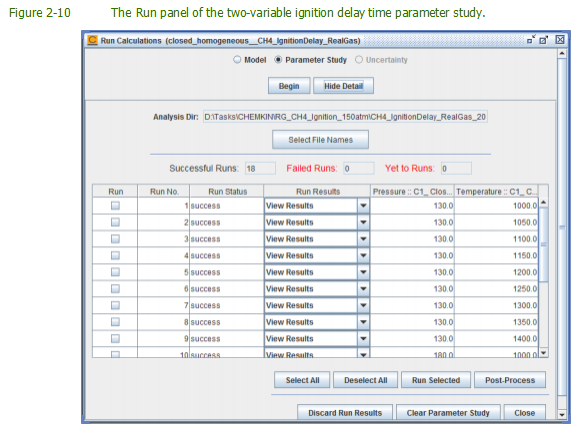
A parameter study for two variables, initial temperature and initial pressure, can be set up to cover all the conditions of interest. The initial reactor pressure will be either 130 atm or 180 atm. For each reactor pressure, the initial reactor temperature will vary from 1000 K to 1400 K with an increment of 50 K. The final parameter study will have a total of 18 cases. Figure 2-10 shows the Run panel of the parameter study.
2.1.2.3 Project Results
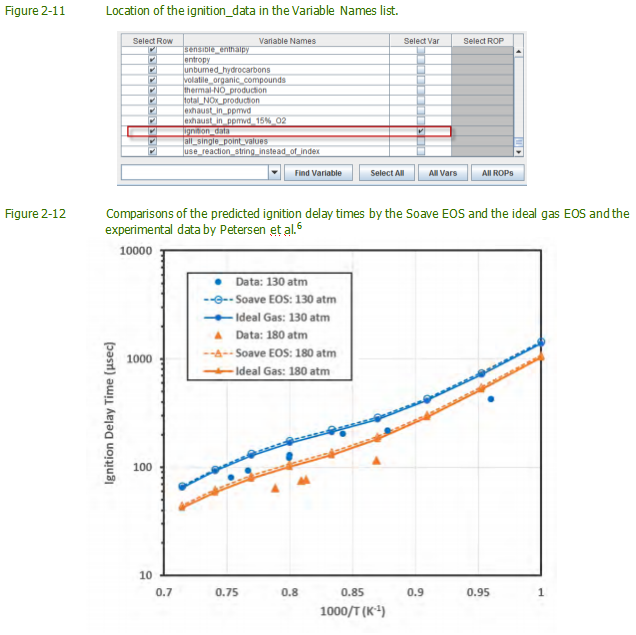
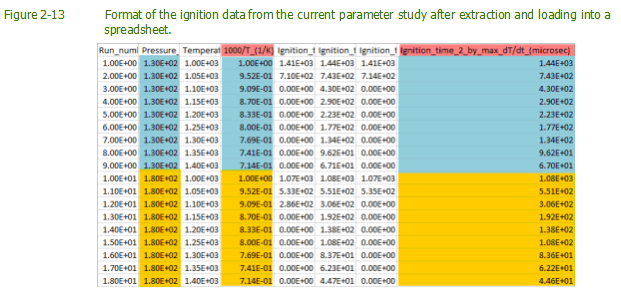
Once all the runs in the parameter study are completed successfully, the An alyze Results window will appear. Select one of the Plot Results options and click the Next Step button to display the Select Post-Processing Variables window. Under the Species > Variables tab, make sure ignition_data in the Variable Names list is selected (see Figure 2-11). Click Process Solution Data to process selected solution data from all the runs.
详细内容请见附件
免责声明:
本页面/内容部分素材来源于互联网公 开 信 息,旨在传递更多信息,不代表本平台立场。
版权归原作者或机构所有,如涉及侵权,请通过平台联系我们,我们将在核实后第一时间处理。
本平台对转载内容的真实性、准确性不作任何保证,用户需自行判断并承担使用风险。