多源方法研究地下采矿引发山体地表沉降的预测与机理

论文题目
Multi-source approach research on prediction and mechanis m of mountain surface subsidence caused by underground mining
Xiang Yang1, Jiabo Geng2 , Xiang Lan2* , Shibin Tang2, Qinglin Chen2
2 School of Emergency Management and Safety Engineering, Jiangxi University of Science and Technology, Ganzhou, China
研究内容
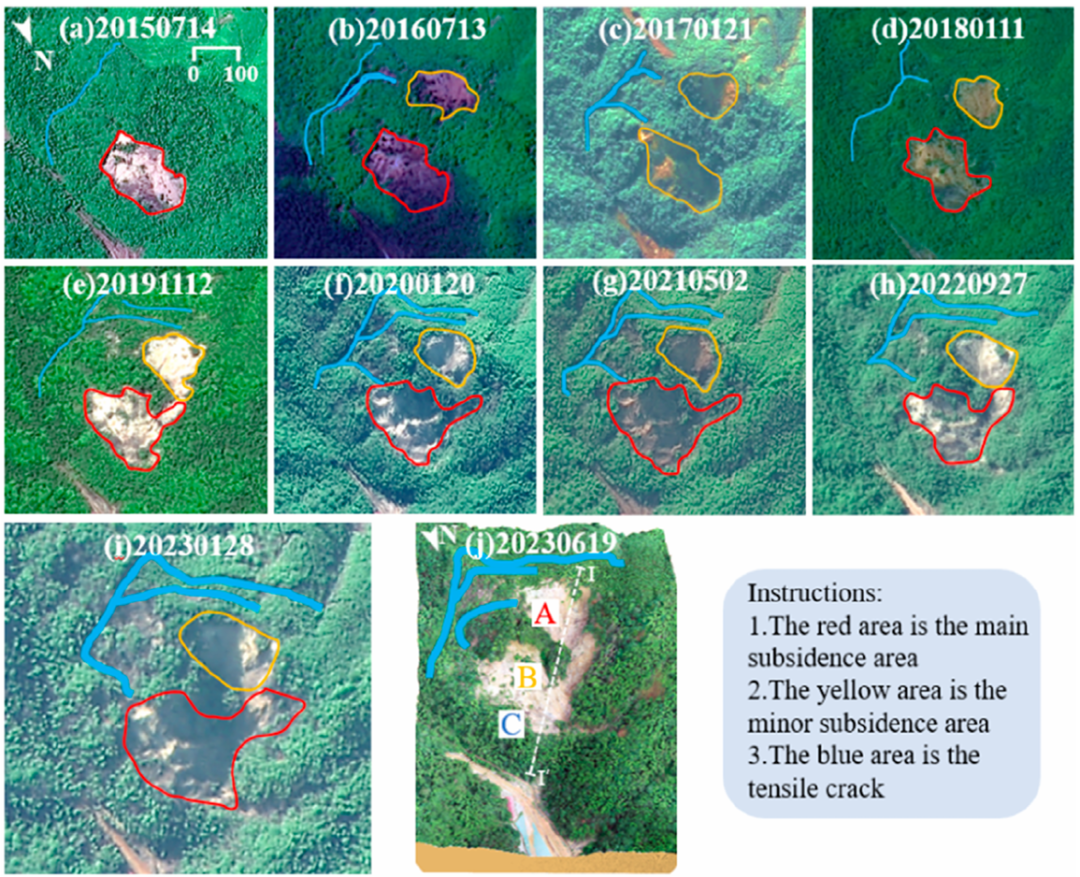
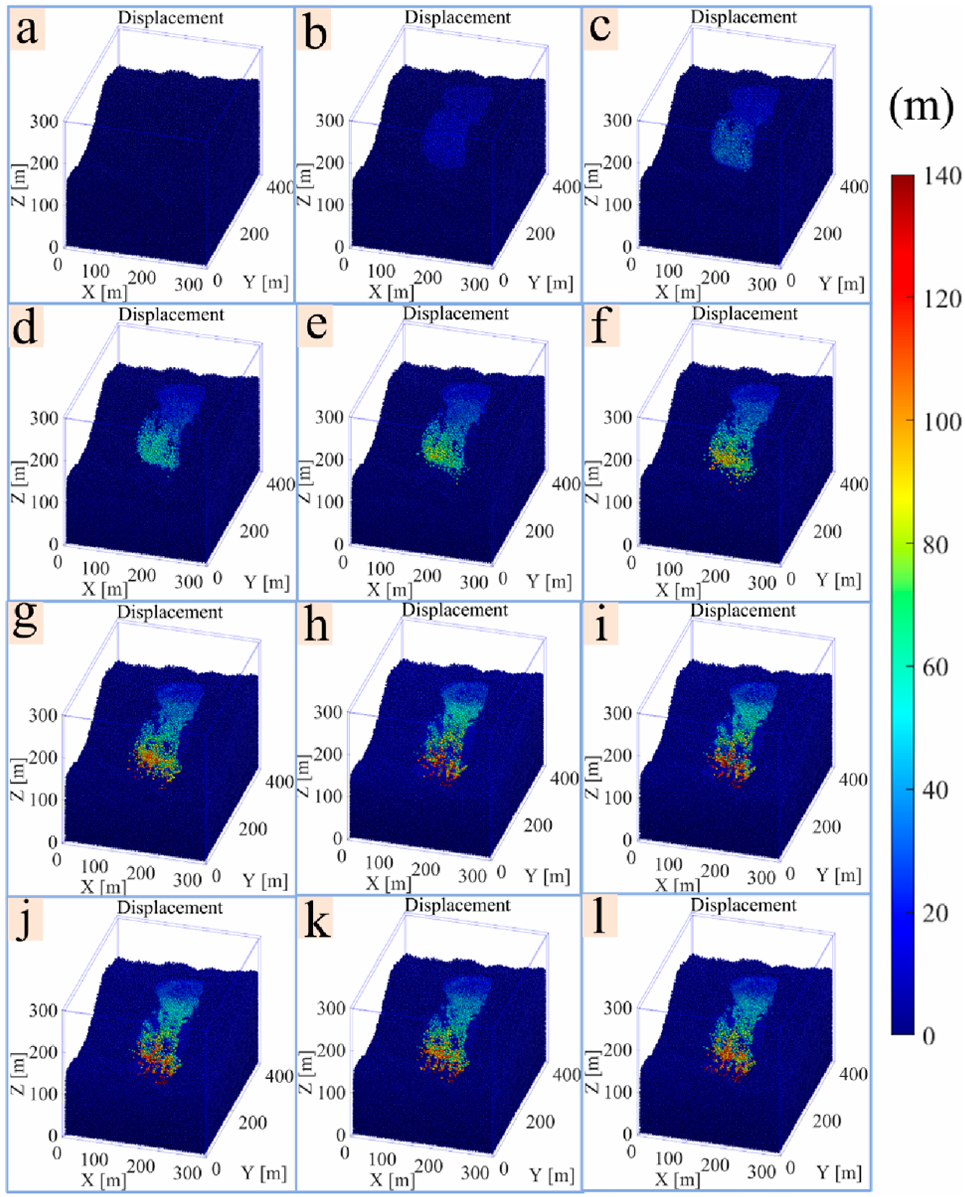
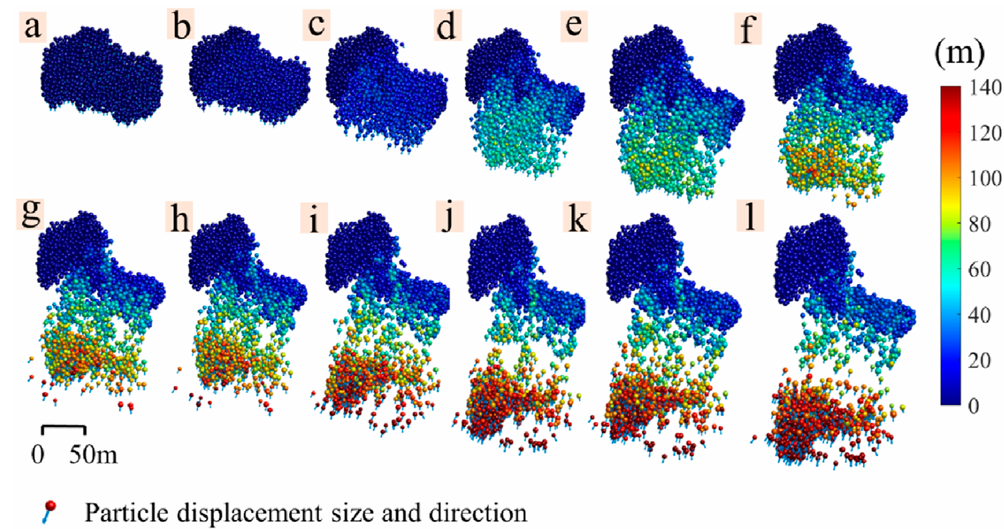
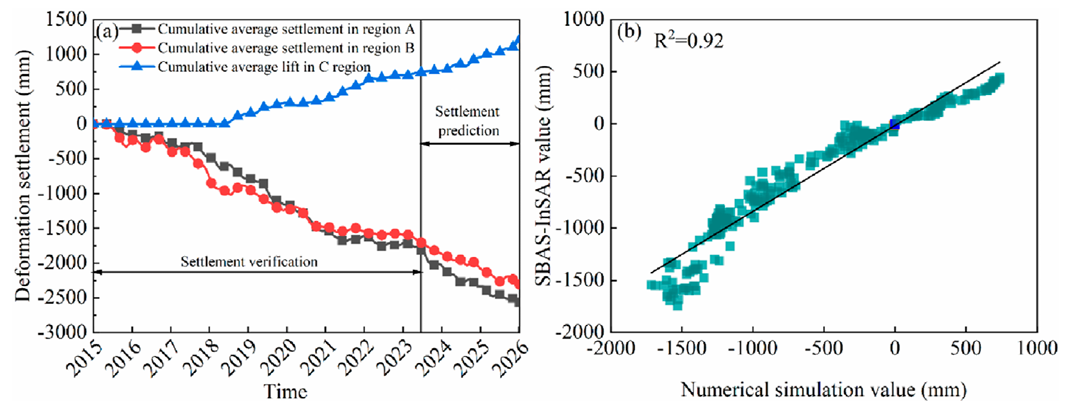
Abstract: Mining activities may trigger hazards such as mountain subsidence. To predict the extent of mountain subsidence and an alyze the evolutionary characteristics of mountain subsidence, the optical images and S mall Baseline Subset InSAR (SBAS-InSAR) method were used, and the mountain subsidence was circled and interpreted. The cumulative subsidence in the area from 2024 to 2026 was predicted by combining the long short-term memory (LSTM) method, and the mountain surface subsidence slip was derived using MatDEM. The results of the study show that mountain surface subsidence begins with the formation of a primary subsidence zone, which slowly leads to the formation of primary and secondary subsidence zones. Under the influence of the penetrating channel, the primary and secondary subsidence areas merge to form a larger subsidence area. The subsidence area gradually disintegrates into several s mall areas during the sliding process, and the s mall areas underneath contribute to the main force of the subsidence movement,withasubstantial slip displacement. Based on this study, it is concluded that the accuracy of the results obtained from the LSTM methodishigherthanthatofthenumericalsimulationresults,andthemaximum cumulative subsidence is expected to reach 2,180 mm in 2026.
Keywords: Underground mining; Mountain surface subsidence; Remote sensing image; SBAS-InSAR; MatDEM
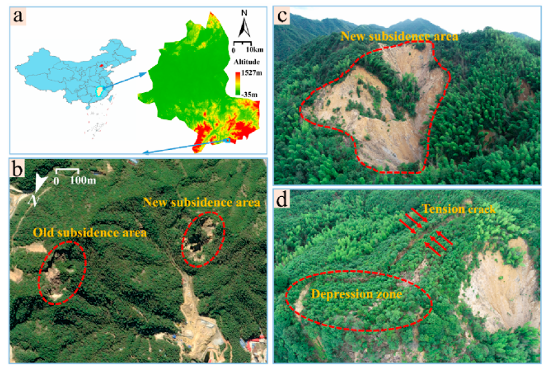
Fig.2 Information map of the study area.(a)Location of the study area.(b)Location of the new and old collapsed areas;data are obtained fromGoogle Maps.(c)Front view of the new collapsed area.(d)Top view of the new collapsed area.(c,d)are obtained from Unmanned Aerial Vehicle.
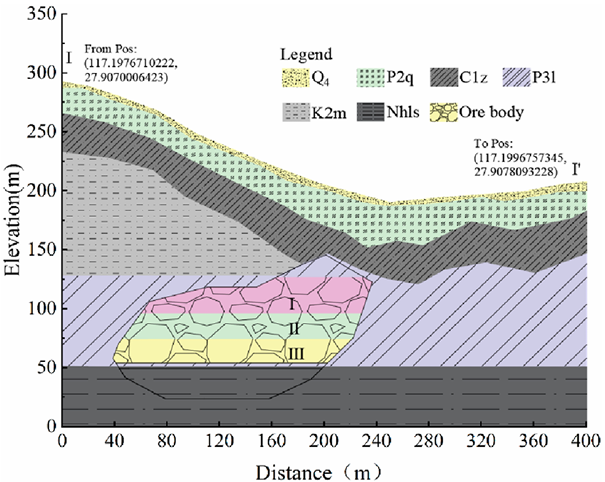
Fig.3 Distribution of stratigraphic properties in the study area.
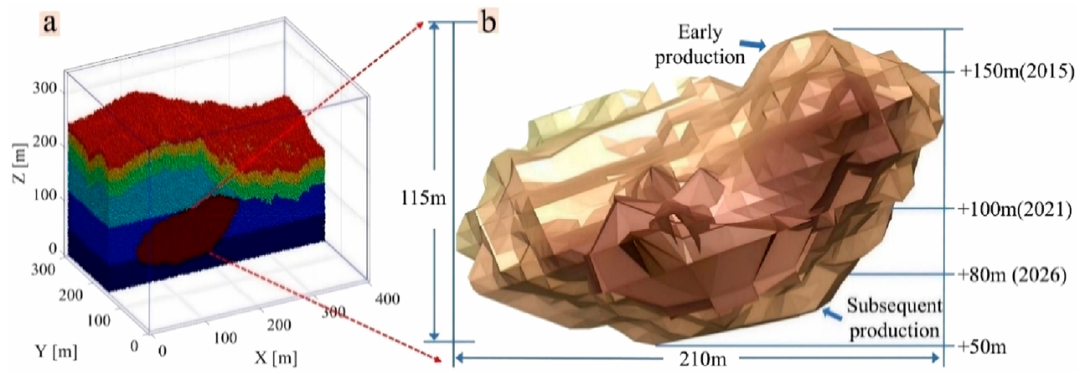
Fig.4 Schematic diagram of ore body hosting and mining. (a) Ore body location. (b) Ore body mining plan.
了解详情
Yang X, Jiabo G, Lan X, et al. Multi-source approach research on prediction and mechanis m of mountain surface subsidence caused by underground mining[J]. Frontiers in Earth Science, 2025, 13: 1642350.


